
Generated: 2026-03-27 03:42 ET
Bitcoin: Bearish Signals Stack Up Across All Three Timeframes 🐻
The weight of evidence across daily, weekly, and monthly timeframes tilts decidedly bearish for Bitcoin heading into early April. Multiple timing signals, structural reversal elections, and trend indicators are converging to suggest continued downside pressure is the higher-probability path — though this is a complex setup with meaningful countertrend risks worth understanding.
📅 Timing Array Confluence
Three separate timeframes are flagging bearish inflection points in close proximity:
On the daily level, the confirmed turning point was March 26, with timing models pointing toward continued weakness into a March 30 Directional Change/Panic Cycle target. The window between now and April 8 (the strongest daily target) may be volatile and choppy — not a clean one-way move.
The weekly timing array confirms the week of March 23 as a past turning point, with the opposite (downward) trend favored into the week of April 6 — the strongest weekly target and a Directional Change signal. A weekly close below $65,295 would shift the odds meaningfully toward deeper losses.
At the monthly level, February was the confirmed turning point. The "opposite trend" into May suggests a corrective bounce or consolidation is possible near-term — but this appears more likely to be a bear market rally within a larger declining structure, not a full reversal.
🔑 Key Levels to Watch
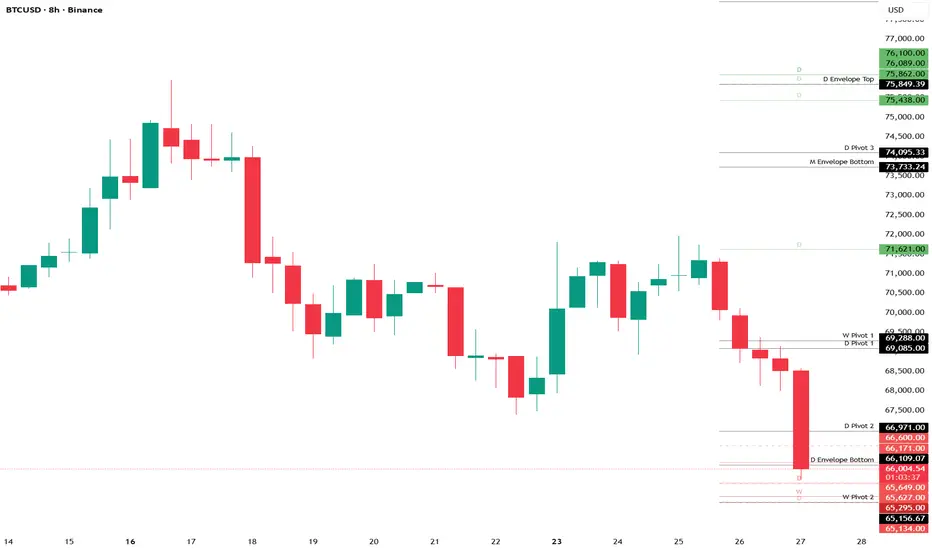
- $69,288 — Weekly pivot. Current price trading below this level maintains bearish momentum; a sustained reclaim would weaken the short thesis
- $66,600 — Nearest daily bearish reversal. A daily close through this level would increase downside probability toward $65,295
- $65,295 — Key weekly bearish reversal (3 Maj). Election on a weekly close favors further decline toward the $63,500–$63,450 zone
- $58,947 — Monthly structural support and nearest active bearish reversal. A monthly close below here would represent a significant structural breakdown
Upside resistance sits at $70,968–$71,320 (weekly resistance band) and the declining trendline from $97,891. A sustained move above $72,000 would begin to challenge the current bearish narrative.
📊 Stochastic & Momentum Context
This is where the setup gets nuanced. The daily Blue stochastic is near 18, the weekly near 20, and the monthly near 14 — all deeply oversold readings. Oversold conditions do not guarantee a bounce. In trending bear markets, these readings can persist. What matters is whether a bullish cross fires — and across all three timeframes, no confirmed bullish stochastic cross has yet occurred. Until that happens, momentum conditions suggest the path of least resistance leans lower.
The weekly momentum model describes current conditions as "crash mode," while the monthly energy model shows contraction near zero — consistent with bear trend consolidation rather than a reversal setup.
⚠️ Invalidation & Risk
This bearish setup is not a certainty. The monthly timing array does favor a corrective bounce into May, which could create sharp short-term upside pressure. A daily close back above $70,000 would reduce near-term downside conviction. A weekly close above $71,320 or a monthly close above $78,369 would more significantly challenge the bearish structural case and likely signal the trend has shifted.
March 30 and April 6 are flagged as high-probability inflection windows — expect elevated volatility around these dates. The direction out of those windows will be telling. 👀
As always, probability favors the bears here, but the market writes its own script.

Aviso legal
As informações e publicações não se destinam a ser, e não constituem, conselhos ou recomendações financeiras, de investimento, comerciais ou de outro tipo fornecidos ou endossados pela TradingView. Leia mais nos Termos de Uso.
Aviso legal
As informações e publicações não se destinam a ser, e não constituem, conselhos ou recomendações financeiras, de investimento, comerciais ou de outro tipo fornecidos ou endossados pela TradingView. Leia mais nos Termos de Uso.