
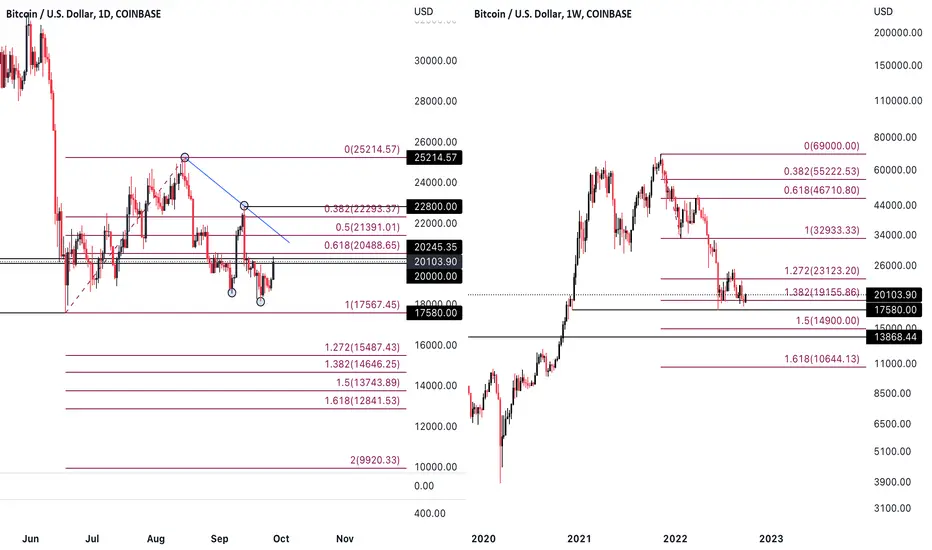
Daily chart:
There is still resistance at 20500, 21391.01 and the trend line above. Before breaking these resistances, BTC may continue to show a lower high and lower low trend.
The main support price is around 17580. If BTC forms a second bottom here, there is a chance to get out of the double bottom pattern.
Target price above:
T1: 22300
T2:22800
T3:25214.57
-
Weekly chart:
The current price is in the support range of 1.272~1.382. If the price falls below the support range, there is a chance to come near 14900 and 10644.13.
-
There is still resistance at 20500, 21391.01 and the trend line above. Before breaking these resistances, BTC may continue to show a lower high and lower low trend.
The main support price is around 17580. If BTC forms a second bottom here, there is a chance to get out of the double bottom pattern.
Target price above:
T1: 22300
T2:22800
T3:25214.57
-
Weekly chart:
The current price is in the support range of 1.272~1.382. If the price falls below the support range, there is a chance to come near 14900 and 10644.13.
-

bybit sign up:
partner.bybit.com/b/56404
partner.bybit.com/b/56404
Aviso legal
As informações e publicações não se destinam a ser, e não constituem, conselhos ou recomendações financeiras, de investimento, comerciais ou de outro tipo fornecidos ou endossados pela TradingView. Leia mais nos Termos de Uso.
bybit sign up:
partner.bybit.com/b/56404
partner.bybit.com/b/56404
Aviso legal
As informações e publicações não se destinam a ser, e não constituem, conselhos ou recomendações financeiras, de investimento, comerciais ou de outro tipo fornecidos ou endossados pela TradingView. Leia mais nos Termos de Uso.