
₿ BTCUSD – 1H CHART ANALYSIS
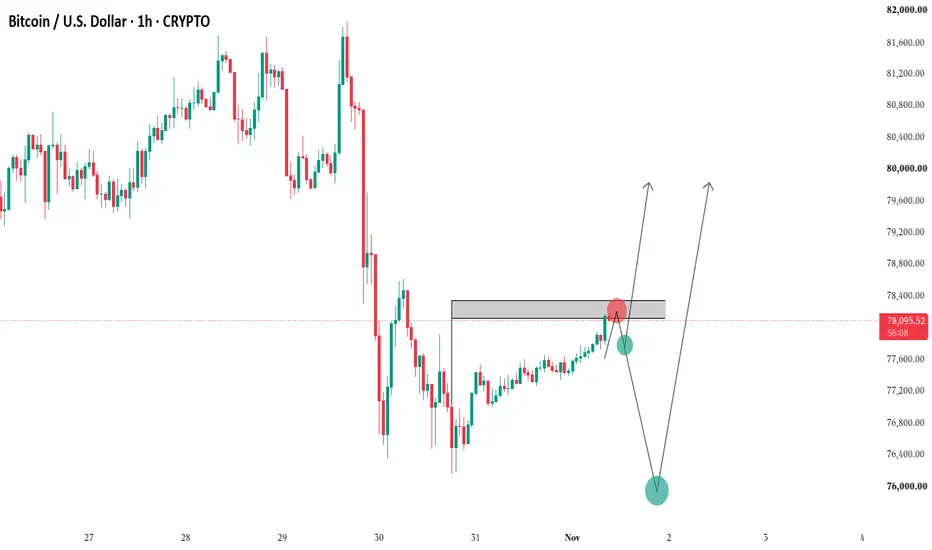
Bitcoin is currently moving towards a strong resistance zone around $78,100–$78,350, where sellers may attempt to take control.
The market is showing a gradual bullish recovery, but price is now approaching an important decision area.
🔴 Bearish Scenario:
If BTC fails to break the resistance zone and shows strong rejection, we may see a downside move towards $77,600, followed by $76,000.
🟢 Bullish Scenario:
If price successfully breaks above the supply zone and sustains its position, further upside towards $79,800–$80,000 could become possible.
🎯 My Focus:
I am watching the reaction around the resistance zone. A clear breakout or confirmed rejection will determine the next potential move.
⚠️ No blind entries. Wait for confirmation and always protect your SL.
Patience is the key. Let the market show its direction.
Bitcoin is currently moving towards a strong resistance zone around $78,100–$78,350, where sellers may attempt to take control.
The market is showing a gradual bullish recovery, but price is now approaching an important decision area.
🔴 Bearish Scenario:
If BTC fails to break the resistance zone and shows strong rejection, we may see a downside move towards $77,600, followed by $76,000.
🟢 Bullish Scenario:
If price successfully breaks above the supply zone and sustains its position, further upside towards $79,800–$80,000 could become possible.
🎯 My Focus:
I am watching the reaction around the resistance zone. A clear breakout or confirmed rejection will determine the next potential move.
⚠️ No blind entries. Wait for confirmation and always protect your SL.
Patience is the key. Let the market show its direction.

Aviso legal
As informações e publicações não se destinam a ser, e não constituem, conselhos ou recomendações financeiras, de investimento, comerciais ou de outro tipo fornecidos ou endossados pela TradingView. Leia mais nos Termos de Uso.
Aviso legal
As informações e publicações não se destinam a ser, e não constituem, conselhos ou recomendações financeiras, de investimento, comerciais ou de outro tipo fornecidos ou endossados pela TradingView. Leia mais nos Termos de Uso.