
Silencing the Noise
Short-term price action is an illusion. To find the true intrinsic value of an asset, you must analyze its macroeconomic cost basis. This is the ultimate Weekly (1W) roadmap of Bitcoin's mathematical architecture.
Macro Bedrock (Realized Price Log Regression):
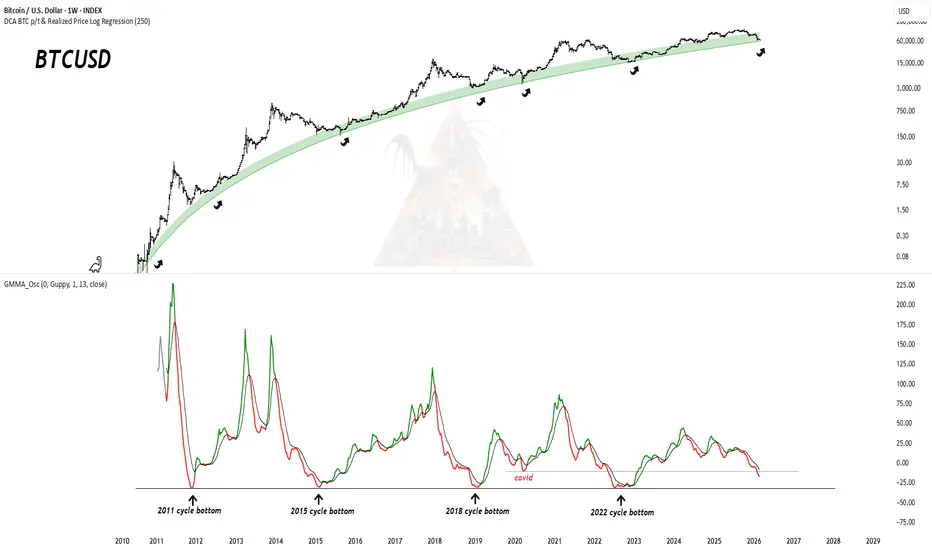
Focus on the upper panel. The black price line has compressed directly onto the thick green band, representing the Realized Price Log Regression—the structural spine of Bitcoin's entire 15-year existence.
The 100% Historical Hit Rate: Observe the black arrows. Every single historical touch of this green band—in 2011, 2015, 2018, the 2020 Covid crash, and 2022—has marked the exact genesis of a generational wealth transfer (Cycle Bottom). The price is currently resting perfectly on this definitive quantitative floor (the 59.7k zone).
GMMA Oscillator Capitulation (Momentum Exhaustion):
The lower panel displays the Guppy Multiple Moving Average Oscillator (GMMA_Osc), a strict quantitative measure of directional momentum and selling pressure.
The oscillator's red line has plunged deep into negative territory, interacting flawlessly with the horizontal dotted support threshold established during the severe 2020 Covid crash.
The Reality Check: Aggressive downward momentum has mathematically zeroed out. The "weak hands" have been flushed from the system, and seller liquidity has been entirely absorbed by Smart Money at this bedrock level.
When the price rests on its 15-year aggregate cost basis while the moving average oscillator hits historical crash capitulation levels, the quantitative Expected Value (EV) dictates aggressive accumulation. The retail crowd fears the drop; institutional algorithms execute at this precise mathematical boundary
Short-term price action is an illusion. To find the true intrinsic value of an asset, you must analyze its macroeconomic cost basis. This is the ultimate Weekly (1W) roadmap of Bitcoin's mathematical architecture.
Macro Bedrock (Realized Price Log Regression):
Focus on the upper panel. The black price line has compressed directly onto the thick green band, representing the Realized Price Log Regression—the structural spine of Bitcoin's entire 15-year existence.
The 100% Historical Hit Rate: Observe the black arrows. Every single historical touch of this green band—in 2011, 2015, 2018, the 2020 Covid crash, and 2022—has marked the exact genesis of a generational wealth transfer (Cycle Bottom). The price is currently resting perfectly on this definitive quantitative floor (the 59.7k zone).
GMMA Oscillator Capitulation (Momentum Exhaustion):
The lower panel displays the Guppy Multiple Moving Average Oscillator (GMMA_Osc), a strict quantitative measure of directional momentum and selling pressure.
The oscillator's red line has plunged deep into negative territory, interacting flawlessly with the horizontal dotted support threshold established during the severe 2020 Covid crash.
The Reality Check: Aggressive downward momentum has mathematically zeroed out. The "weak hands" have been flushed from the system, and seller liquidity has been entirely absorbed by Smart Money at this bedrock level.
When the price rests on its 15-year aggregate cost basis while the moving average oscillator hits historical crash capitulation levels, the quantitative Expected Value (EV) dictates aggressive accumulation. The retail crowd fears the drop; institutional algorithms execute at this precise mathematical boundary

Follow me on X
Subscribe
x.com/Cryptollica/creator-subscriptions/subscribe
Subscribe
x.com/Cryptollica/creator-subscriptions/subscribe
Aviso legal
As informações e publicações não se destinam a ser, e não constituem, conselhos ou recomendações financeiras, de investimento, comerciais ou de outro tipo fornecidos ou endossados pela TradingView. Leia mais nos Termos de Uso.
Follow me on X
Subscribe
x.com/Cryptollica/creator-subscriptions/subscribe
Subscribe
x.com/Cryptollica/creator-subscriptions/subscribe
Aviso legal
As informações e publicações não se destinam a ser, e não constituem, conselhos ou recomendações financeiras, de investimento, comerciais ou de outro tipo fornecidos ou endossados pela TradingView. Leia mais nos Termos de Uso.