
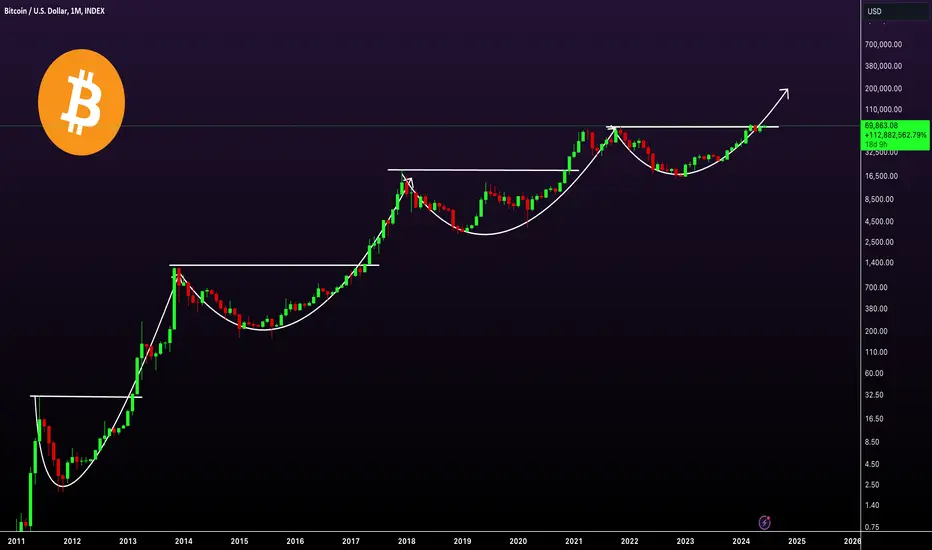
Bitcoin long-term chart analysis
In 2013, the price of Bitcoin broke its previous ATH and moved approximately 3700% after the breakout. In 2017, Bitcoin's price increased by over 1450% after breaking its previous ATH. In 2021, Bitcoin's price rose by more than 250% after the previous ATH breakout.
This year, the price broke the 2021 ATH. We can expect a bullish move from the current level, with a potential 100-200% increase in Bitcoin this year.
In 2013, the price of Bitcoin broke its previous ATH and moved approximately 3700% after the breakout. In 2017, Bitcoin's price increased by over 1450% after breaking its previous ATH. In 2021, Bitcoin's price rose by more than 250% after the previous ATH breakout.
This year, the price broke the 2021 ATH. We can expect a bullish move from the current level, with a potential 100-200% increase in Bitcoin this year.

🚀Telegram : t.me/hexatrades
🌐Website: hexatrades.io/
🗣️Twitter(X): twitter.com/HexaTrades
🌐Website: hexatrades.io/
🗣️Twitter(X): twitter.com/HexaTrades
Publicações relacionadas
Aviso legal
As informações e publicações não se destinam a ser, e não constituem, conselhos ou recomendações financeiras, de investimento, comerciais ou de outro tipo fornecidos ou endossados pela TradingView. Leia mais nos Termos de Uso.
🚀Telegram : t.me/hexatrades
🌐Website: hexatrades.io/
🗣️Twitter(X): twitter.com/HexaTrades
🌐Website: hexatrades.io/
🗣️Twitter(X): twitter.com/HexaTrades
Publicações relacionadas
Aviso legal
As informações e publicações não se destinam a ser, e não constituem, conselhos ou recomendações financeiras, de investimento, comerciais ou de outro tipo fornecidos ou endossados pela TradingView. Leia mais nos Termos de Uso.