
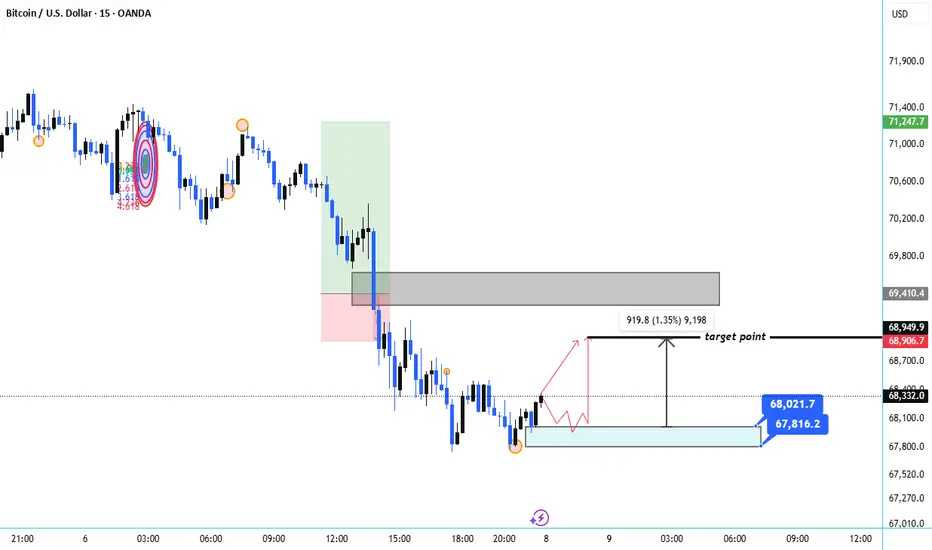
The chart shows a strong bearish structure followed by price entering a demand/support zone around 67,800 – 67,600. This area previously acted as liquidity where buyers stepped in.
🔎 Key Observations
Clear Downtrend: Market formed consistent lower highs and lower lows, confirming bearish momentum.
Supply Zone Rejection: The grey zone around 69,300 – 69,500 acted as strong resistance where sellers entered aggressively.
Liquidity Sweep: The recent wick near 67,800 suggests a sell-side liquidity grab, often followed by a short-term bounce.
Accumulation Zone: Price is consolidating inside the blue demand zone (≈67,800 – 67,600) indicating potential buyer interest.
📈 Bullish Recovery Scenario
If the support holds:
Entry Zone: 67,800 – 67,600
Target Move: Toward 68,900 – 69,000
Projected Move: About +1.35% (~900 points) upside.
This move would likely be a retracement toward the previous supply zone.
⚠️ Bearish Scenario
If price breaks and closes below 67,600, the market could continue the downtrend toward:
67,200
67,000 psychological support
🧠 Summary
Market trend: Bearish
Short-term bias: Bullish pullback from demand
Key resistance: 68,900 – 69,400
Key support: 67,600
✔ Expect a short-term bounce before potential continuation of the larger bearish trend.
🔎 Key Observations
Clear Downtrend: Market formed consistent lower highs and lower lows, confirming bearish momentum.
Supply Zone Rejection: The grey zone around 69,300 – 69,500 acted as strong resistance where sellers entered aggressively.
Liquidity Sweep: The recent wick near 67,800 suggests a sell-side liquidity grab, often followed by a short-term bounce.
Accumulation Zone: Price is consolidating inside the blue demand zone (≈67,800 – 67,600) indicating potential buyer interest.
📈 Bullish Recovery Scenario
If the support holds:
Entry Zone: 67,800 – 67,600
Target Move: Toward 68,900 – 69,000
Projected Move: About +1.35% (~900 points) upside.
This move would likely be a retracement toward the previous supply zone.
⚠️ Bearish Scenario
If price breaks and closes below 67,600, the market could continue the downtrend toward:
67,200
67,000 psychological support
🧠 Summary
Market trend: Bearish
Short-term bias: Bullish pullback from demand
Key resistance: 68,900 – 69,400
Key support: 67,600
✔ Expect a short-term bounce before potential continuation of the larger bearish trend.

JOIN MY TELEGRAM CHANNEL LINK t.me/mindgolde JOIN MY TELEGRAM CHANNEL LINK t.me/mindgolde
Aviso legal
As informações e publicações não se destinam a ser, e não constituem, conselhos ou recomendações financeiras, de investimento, comerciais ou de outro tipo fornecidos ou endossados pela TradingView. Leia mais nos Termos de Uso.
JOIN MY TELEGRAM CHANNEL LINK t.me/mindgolde JOIN MY TELEGRAM CHANNEL LINK t.me/mindgolde
Aviso legal
As informações e publicações não se destinam a ser, e não constituem, conselhos ou recomendações financeiras, de investimento, comerciais ou de outro tipo fornecidos ou endossados pela TradingView. Leia mais nos Termos de Uso.