
I've been among the first to compare Bitcoin's Cycles through the spectrum of divergence and convergence with the most recent one being in June:
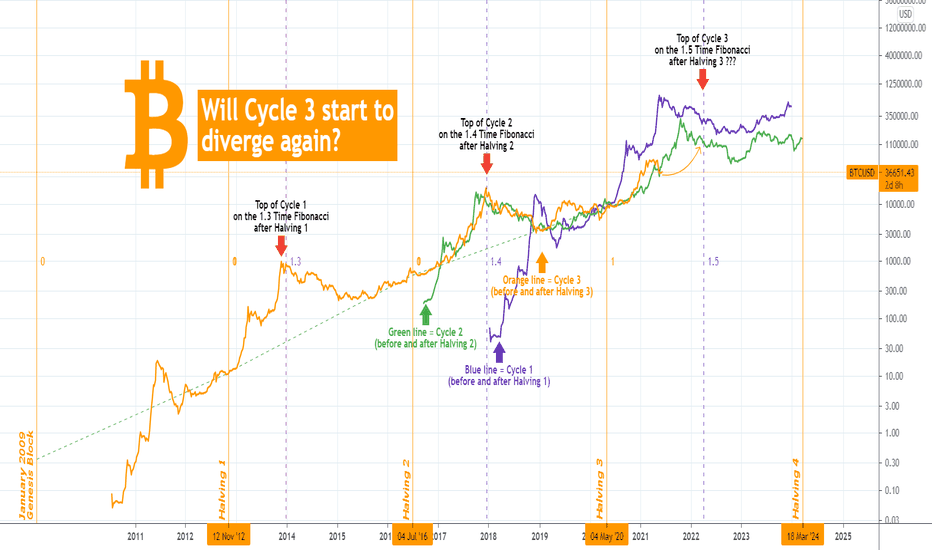
You may see more examples of my methodology on this at the end of this analysis.
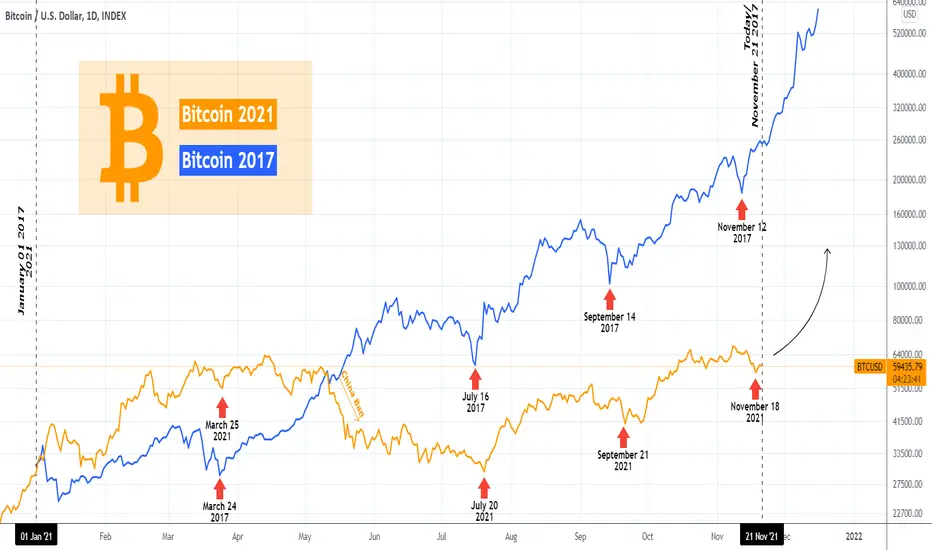
On the current one I simply compare the last year of the 2017 Bull Cycle with the 2021 phase of the Bull Cycle. The similarities are more than obvious. As you see, key lows during both Cycles have (so far) been aligned: March, July, September and November. It may seem as a coincidence but as I've shown on previous analyses, BTC has a unique tendency to repeat each cyclical behavior to a greater or lesser extent each time.
Since June/ July in particular (after the China ban on crypto mining in May), the two sequences have been remarkably identical. Compressing the 2017 phase down to the 2021's scale, helps a great deal at more effectively displaying this correlation:

The chart above shows just how converged the two cycles are since June and leaves promise that if history repeats itself again, there is an enormous end of the year parabolic rally about to start.
What do you think? Is this approach reliable in forecasting BTC's price action? Do you also expect a strong rally to close out the year or see something completely different coming? Feel free to share your work and let me know in the comments section!
--------------------------------------------------------------------------------------------------------
Please like, subscribe and share your ideas and charts with the community!
--------------------------------------------------------------------------------------------------------
More studies on the cyclical convergence/ divergence approach:
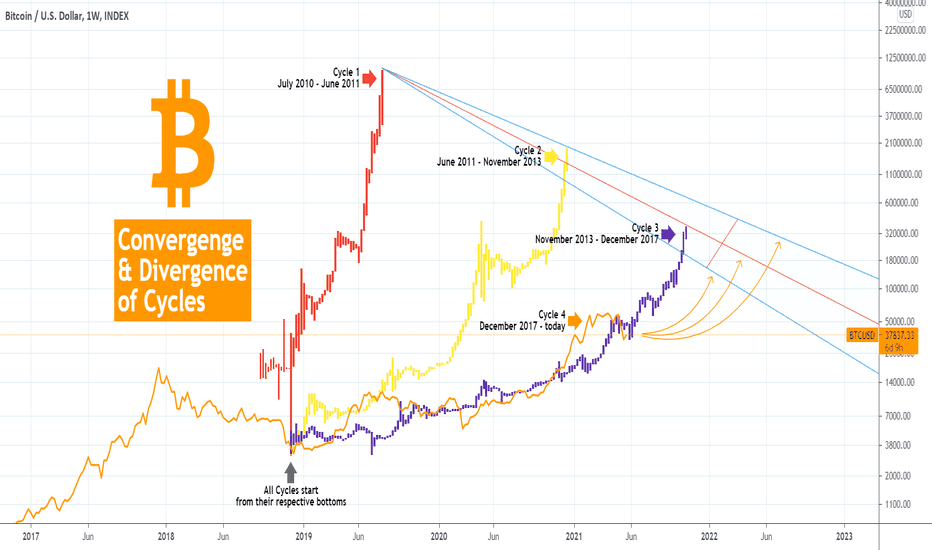
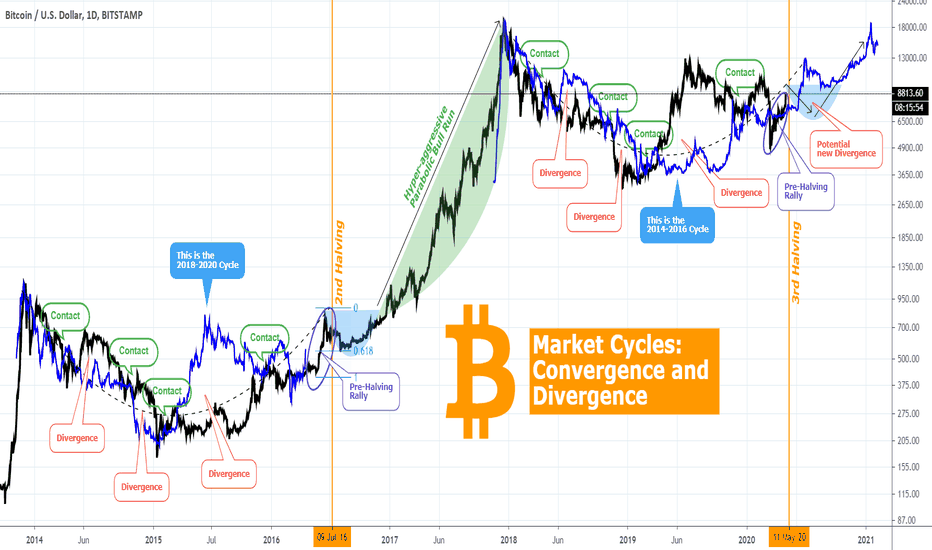
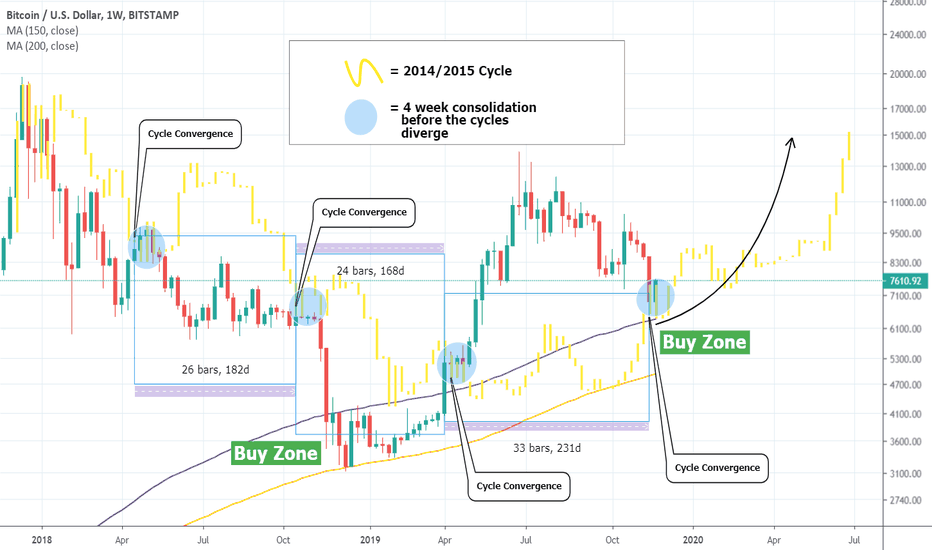
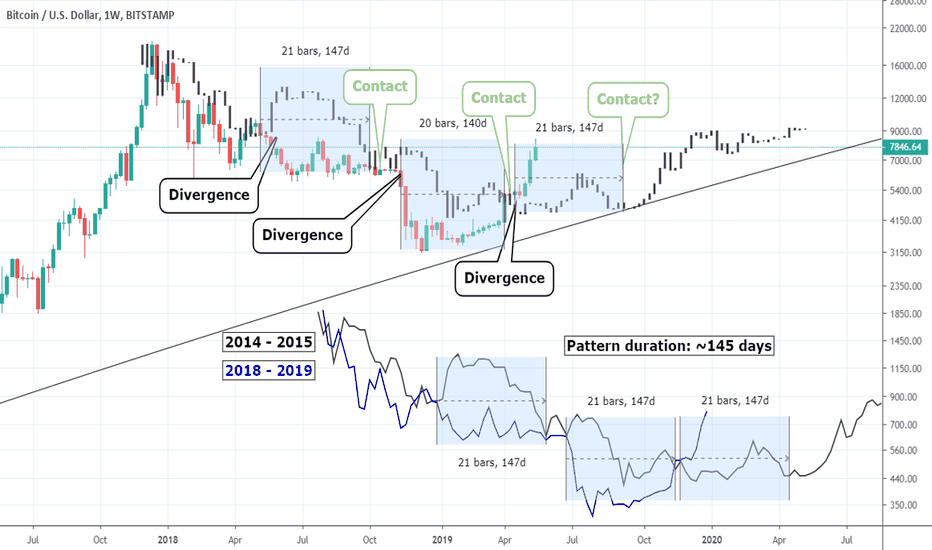
You may see more examples of my methodology on this at the end of this analysis.
On the current one I simply compare the last year of the 2017 Bull Cycle with the 2021 phase of the Bull Cycle. The similarities are more than obvious. As you see, key lows during both Cycles have (so far) been aligned: March, July, September and November. It may seem as a coincidence but as I've shown on previous analyses, BTC has a unique tendency to repeat each cyclical behavior to a greater or lesser extent each time.
Since June/ July in particular (after the China ban on crypto mining in May), the two sequences have been remarkably identical. Compressing the 2017 phase down to the 2021's scale, helps a great deal at more effectively displaying this correlation:
The chart above shows just how converged the two cycles are since June and leaves promise that if history repeats itself again, there is an enormous end of the year parabolic rally about to start.
What do you think? Is this approach reliable in forecasting BTC's price action? Do you also expect a strong rally to close out the year or see something completely different coming? Feel free to share your work and let me know in the comments section!
--------------------------------------------------------------------------------------------------------
Please like, subscribe and share your ideas and charts with the community!
--------------------------------------------------------------------------------------------------------
More studies on the cyclical convergence/ divergence approach:

I trade Crypto, Forex, Indices & Commodities on PrimeXBT — all from one account with TradingView charts 👉 tradingshot.short.gy/PrimeXBT
I also use TradeNation for fixed spreads & zero commission 👉 tradingshot.short.gy/Tradenation
I also use TradeNation for fixed spreads & zero commission 👉 tradingshot.short.gy/Tradenation
Aviso legal
As informações e publicações não se destinam a ser, e não constituem, conselhos ou recomendações financeiras, de investimento, comerciais ou de outro tipo fornecidos ou endossados pela TradingView. Leia mais nos Termos de Uso.
I trade Crypto, Forex, Indices & Commodities on PrimeXBT — all from one account with TradingView charts 👉 tradingshot.short.gy/PrimeXBT
I also use TradeNation for fixed spreads & zero commission 👉 tradingshot.short.gy/Tradenation
I also use TradeNation for fixed spreads & zero commission 👉 tradingshot.short.gy/Tradenation
Aviso legal
As informações e publicações não se destinam a ser, e não constituem, conselhos ou recomendações financeiras, de investimento, comerciais ou de outro tipo fornecidos ou endossados pela TradingView. Leia mais nos Termos de Uso.