
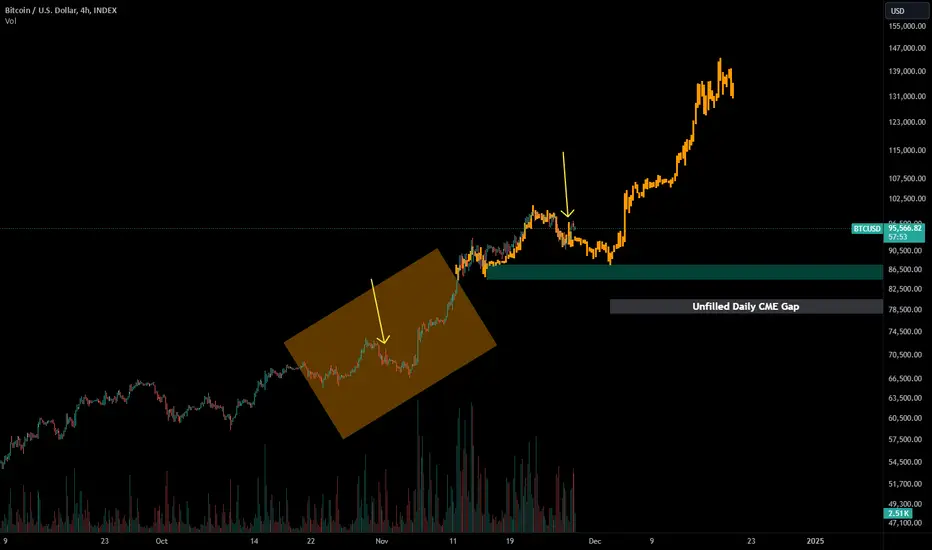
Possible repeating pattern to the leg up from 65 to 98k. Yellow arrow shows where we are in the same setup that is highlighted by the orange rectangle.
If this is true, we'd see something like a drop from here to mid-to-low 80k range before finding enough buyers for the push above 100k.
Long-term long, short-term short.
Reminder that there is a daily CME gap yet unfilled below this area however, around 78 to 80.7k:

If this is true, we'd see something like a drop from here to mid-to-low 80k range before finding enough buyers for the push above 100k.
Long-term long, short-term short.
Reminder that there is a daily CME gap yet unfilled below this area however, around 78 to 80.7k:

Aviso legal
As informações e publicações não se destinam a ser, e não constituem, conselhos ou recomendações financeiras, de investimento, comerciais ou de outro tipo fornecidos ou endossados pela TradingView. Leia mais nos Termos de Uso.
Aviso legal
As informações e publicações não se destinam a ser, e não constituem, conselhos ou recomendações financeiras, de investimento, comerciais ou de outro tipo fornecidos ou endossados pela TradingView. Leia mais nos Termos de Uso.