
Technical Analysis and Outlook:
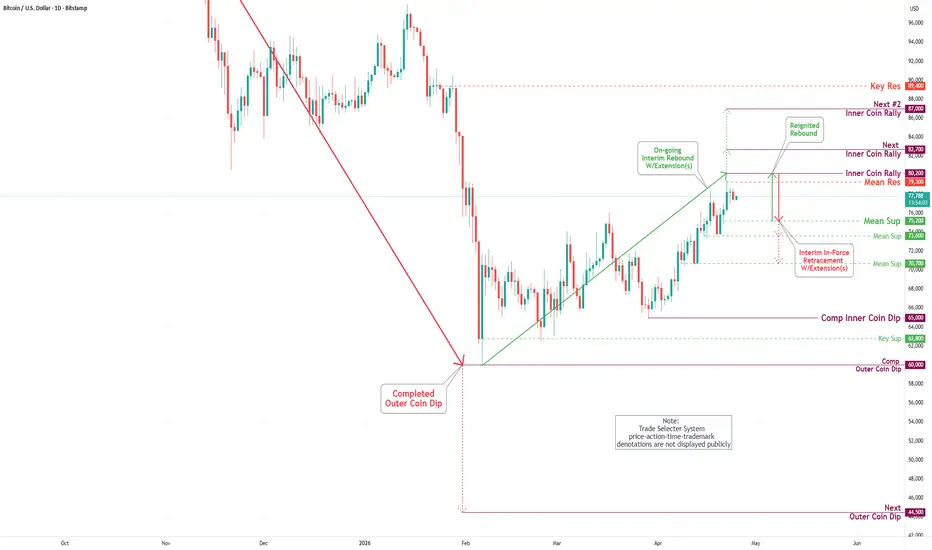
Bitcoin prices retested a crucial support level at $74,000 in this week's trading session and then surged strongly to the upside, retesting the Inner Coin rally at $78,500. Currently, the cryptocurrency is unfolding an upward move towards the extended target of $80,200, via a Key Resistance at $79,300.
Advanced market analysis indicates a continuous upward momentum towards the specified target. However, once this target is reached, we anticipate an interim retracement down to the identified Mean Support at $75,200, with additional potential support target levels at $73,600 and $70,700 to consider.
In light of all relevant factors, a notable rebound is expected to occur upon reaching the identified support levels.
Bitcoin prices retested a crucial support level at $74,000 in this week's trading session and then surged strongly to the upside, retesting the Inner Coin rally at $78,500. Currently, the cryptocurrency is unfolding an upward move towards the extended target of $80,200, via a Key Resistance at $79,300.
Advanced market analysis indicates a continuous upward momentum towards the specified target. However, once this target is reached, we anticipate an interim retracement down to the identified Mean Support at $75,200, with additional potential support target levels at $73,600 and $70,700 to consider.
In light of all relevant factors, a notable rebound is expected to occur upon reaching the identified support levels.

Publicações relacionadas
Aviso legal
As informações e publicações não se destinam a ser, e não constituem, conselhos ou recomendações financeiras, de investimento, comerciais ou de outro tipo fornecidos ou endossados pela TradingView. Leia mais nos Termos de Uso.
Publicações relacionadas
Aviso legal
As informações e publicações não se destinam a ser, e não constituem, conselhos ou recomendações financeiras, de investimento, comerciais ou de outro tipo fornecidos ou endossados pela TradingView. Leia mais nos Termos de Uso.