
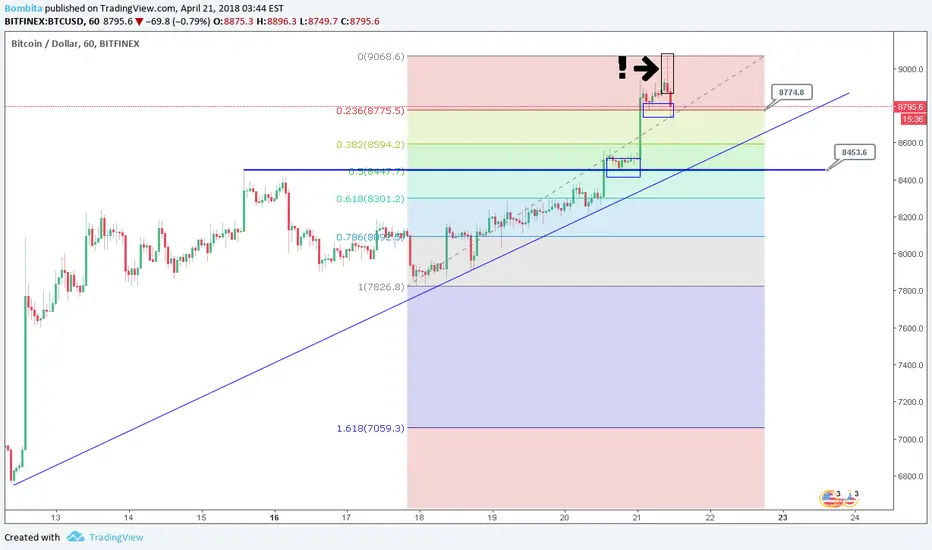
The falling star
On the hour chart we can see the falling star pattern ( in the black rectangle ) It's the bearish reversal pattern , be careful.
I marked the support zones and trend line.
Let's see what happens next.
The MACD divergence

The RSI overbought

On the hour chart we can see the falling star pattern ( in the black rectangle ) It's the bearish reversal pattern , be careful.
I marked the support zones and trend line.
Let's see what happens next.
The MACD divergence
The RSI overbought
Nota
On the hour chart we can se the peculiar pennant.ENTRY The closure of the four hour candle above the level of 9070 or 8999 ( less safe )
Nota
ImportantlyThe closure of the four hour candle above the level of 9070 will mean cancellation the falling star pattern.
It's will be the strong bullish sign
Nota
ImportantlyThe closure of the four hour candle above the level of 9070 will mean the cancellation of the falling star pattern
It's will be the strong bullish sign
Nota
The price tests the resistance levelNota
The another falling star , be careful Nota
I have adjusted the trading range.STOP-LIMIT 9341 ( In case of a sharp rise )
ENTRY The closure of the four hour candle above the level of 9070
Nota
The MACD shows the change of trend , it's the weak signal , but be careful Nota
The price confirmed the trend line againThe resistance zones

Aviso legal
As informações e publicações não se destinam a ser, e não constituem, conselhos ou recomendações financeiras, de investimento, comerciais ou de outro tipo fornecidos ou endossados pela TradingView. Leia mais nos Termos de Uso.
Aviso legal
As informações e publicações não se destinam a ser, e não constituem, conselhos ou recomendações financeiras, de investimento, comerciais ou de outro tipo fornecidos ou endossados pela TradingView. Leia mais nos Termos de Uso.