
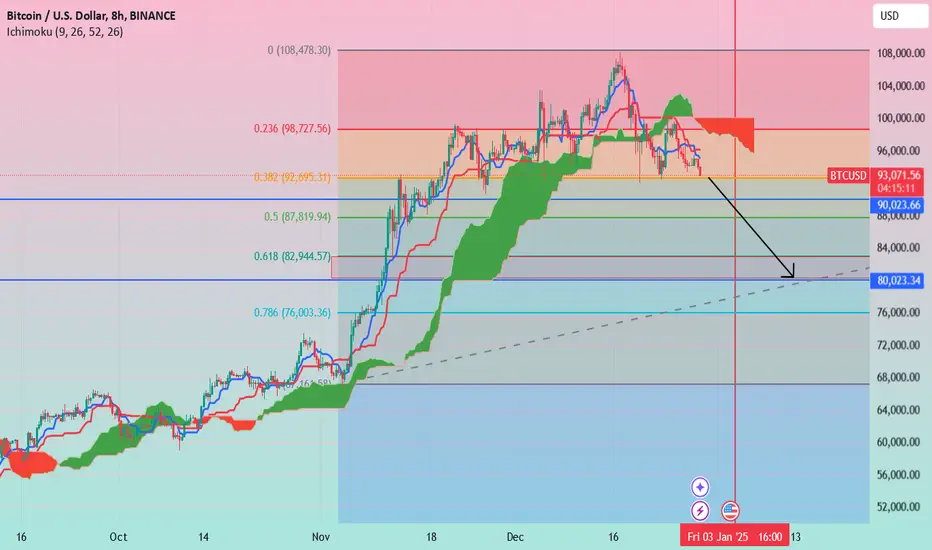
The key levels are marked on the chart to identify potential support and resistance zones. The price seems to be hovering around the 0.382 retracement level (~92,695), with a potential move downward. The price has broken below the cloud, which could be interpreted as bearish.
The downward trend is targeting the region around the 0.786 retracement level. This area could act as a potential support zone.
The downward trend is targeting the region around the 0.786 retracement level. This area could act as a potential support zone.

Aviso legal
As informações e publicações não se destinam a ser, e não constituem, conselhos ou recomendações financeiras, de investimento, comerciais ou de outro tipo fornecidos ou endossados pela TradingView. Leia mais nos Termos de Uso.
Aviso legal
As informações e publicações não se destinam a ser, e não constituem, conselhos ou recomendações financeiras, de investimento, comerciais ou de outro tipo fornecidos ou endossados pela TradingView. Leia mais nos Termos de Uso.