Hi everyone,
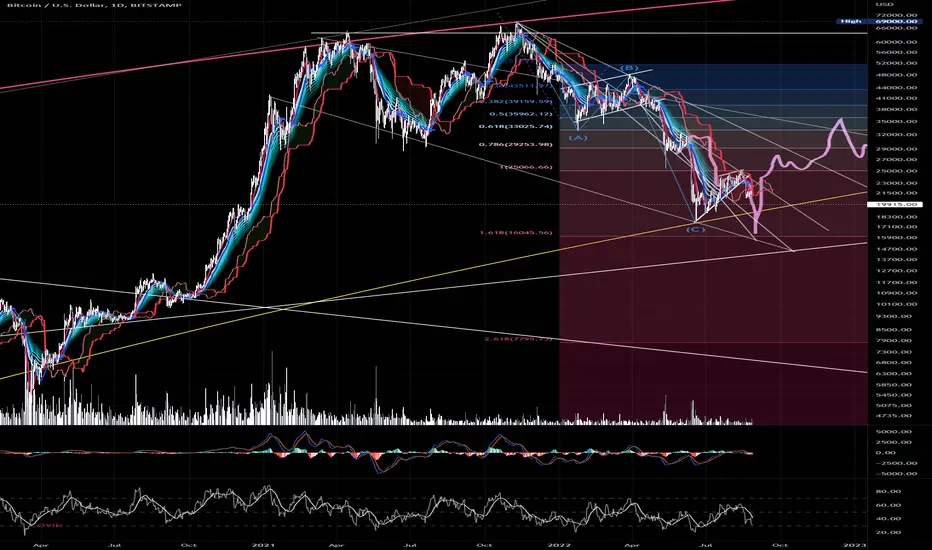
I didn't wanted to share this before,but i feel like i really want to give a warning of an impending flashcrash which will be the last low for a couple of years.
BUYING OPPORTUNITY! - NO FINANCIAL ADVICE BTCUSD
May the fortune favor the bold,
CYANE
I didn't wanted to share this before,but i feel like i really want to give a warning of an impending flashcrash which will be the last low for a couple of years.
BUYING OPPORTUNITY! - NO FINANCIAL ADVICE
BTCUSDMay the fortune favor the bold,
CYANE
Nota
Insane accuracy once again. Due to the fact that this chart is over two year old, Bitcoin will moon from here to 140-160k until around February - March 2025 and not go sideways until 2027 like in the original prediction. Please check my newer posts.Trade ativo
*'IMPENDING FLASHCRASH' - 2022 MAP FOLLOW UP (BEARISH BIAS)*Original trading map: Aug 28, 2022 -> over 3 years old.
All drawings were placed in 2022 and remain untouched. Check the date.
*THE OCTOBER 10TH, 2025 FLUSH*
On October 10th, 2025 we saw a full market liquidity vacuum: even several top-30 coins dropped around -80% within minutes (!) before partial rebounds. Historically, after a vertical down-spike like that one, alts lag-dump for months while BTC chops or trends lower which means lower highs, trapped liquidity, and slow and painful bleed. The last time I experienced something like that at a 'market top' was on December 3rd, 2021.
*BEARISH PATH (PRIMARY)*
Rejection zone: 126.0–126.8k at the red multi-cycle trendline (same line price tagged to the dollar).
Confirmation (need ONE on weekly):
Weekly close below 100k–104k pivot, or clear lower high beneath 123k after a bounce.
DOWNSIDE LADDER (LIQUIDITY POOLS):
92–94k (range floor)
86–88k (prior shelf)
76–78k (yellow diagonal confluence)
If even that breaks, we're heading straight to 68–72k.
Absolute capitulation level still on the 2022 map: around 44.7k (complete liquidation if macro risk spirals).
(Bear invalidation: A weekly close back above 126.5k and holding 121–123k as support on retest. Until then, 121–126k = sell/hedge zone.)
*BULLISH CONTINGENCY (ONLY IF PROVEN)*
Trigger: Weekly close greater than 126.5k above the red line.
Acceptance: Successful retest/hold at 121–123k.
Targets: 140–160k, then 180–210k if volume/participation expand after retest.
Failure: Lose 121k on a weekly close after breakout -> back inside, resume bear path.
TLDR:
Post-crash conditions + multi-cycle resistance = distribution risk. Until the market reclaims and holds above the red curved line i drew over three years ago, I'm treating bounces as lower-high candidates and respecting the downside ladder.
AS ALWAYS, THIS IS NO FINANCIAL ADVICE. DYOR.
-CYANE

Publicações relacionadas
Aviso legal
As informações e publicações não se destinam a ser, e não constituem, conselhos ou recomendações financeiras, de investimento, comerciais ou de outro tipo fornecidos ou endossados pela TradingView. Leia mais nos Termos de Uso.
Publicações relacionadas
Aviso legal
As informações e publicações não se destinam a ser, e não constituem, conselhos ou recomendações financeiras, de investimento, comerciais ou de outro tipo fornecidos ou endossados pela TradingView. Leia mais nos Termos de Uso.