
In the last major rally, BTC needed approximately $522 billion to drive a 51% surge. Data from Feb 5 to Mar 4, 2024, highlights the substantial capital influx required for such a rise. Given current market dynamics, the availability of similar liquidity to ignite another significant price jump seems unlikely.
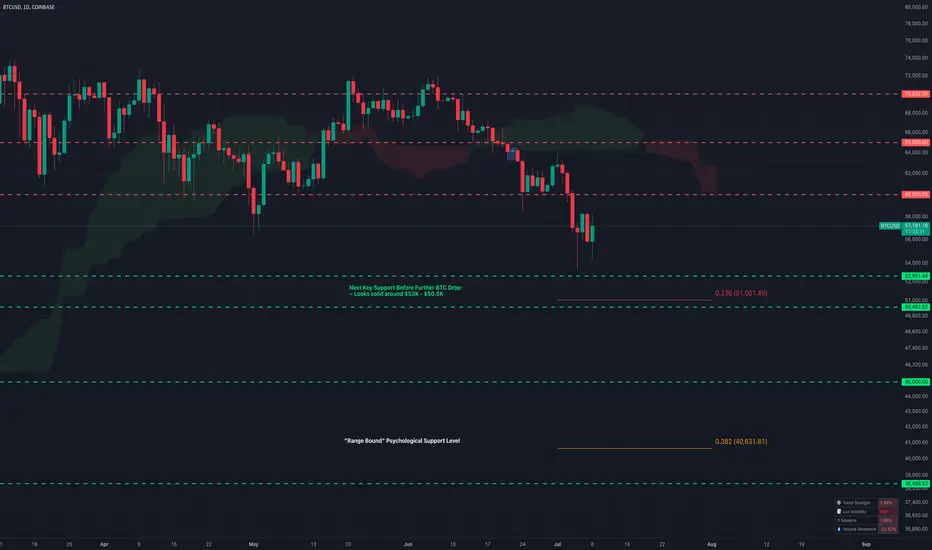
1D TF highlights a key support level around $ 53K ~ $ 50.5K. This range is crucial to monitor before expecting further price drops. Additionally, there's a strong resistance zone at $60K ~ $65K. Bitcoin is likely to test the $ 65K resistance level before resuming its decline.
🔴 Still Keeping My Bear Stance 🧸 I’m waiting for the Price RANGE of $ 30K ~ $ 25K to open a LONG Position. Disclaimer: NFA ➖ DYOR 🧠 💡 Open for discussion on this analysis 💬
1D TF highlights a key support level around $ 53K ~ $ 50.5K. This range is crucial to monitor before expecting further price drops. Additionally, there's a strong resistance zone at $60K ~ $65K. Bitcoin is likely to test the $ 65K resistance level before resuming its decline.
🔴 Still Keeping My Bear Stance 🧸 I’m waiting for the Price RANGE of $ 30K ~ $ 25K to open a LONG Position. Disclaimer: NFA ➖ DYOR 🧠 💡 Open for discussion on this analysis 💬

Always remember the golden rule of investing: never risk more than you can afford to lose. Trade carefully and wisely. May each of your transactions be successful!
Publicações relacionadas
Aviso legal
As informações e publicações não se destinam a ser, e não constituem, conselhos ou recomendações financeiras, de investimento, comerciais ou de outro tipo fornecidos ou endossados pela TradingView. Leia mais nos Termos de Uso.
Always remember the golden rule of investing: never risk more than you can afford to lose. Trade carefully and wisely. May each of your transactions be successful!
Publicações relacionadas
Aviso legal
As informações e publicações não se destinam a ser, e não constituem, conselhos ou recomendações financeiras, de investimento, comerciais ou de outro tipo fornecidos ou endossados pela TradingView. Leia mais nos Termos de Uso.