
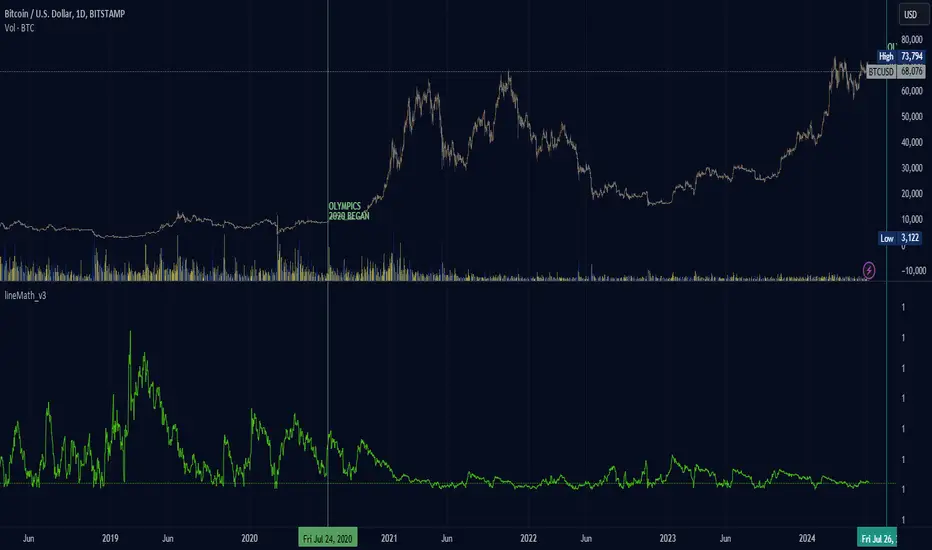
not sure what I created here; the indicator line shows slope information that leads before the price increases in the future. may have something to do with the halving and reduction in BTC. the green line decreases as the price grows in the same way a previous chart prices look smaller as the price reaches higher. the only difference here is that the graph lines are happening before the price of BTC peaks, odd. ...now I have to wait to see if the indicator line changes dramatically ahead of the price of BTC...

Aviso legal
As informações e publicações não se destinam a ser, e não constituem, conselhos ou recomendações financeiras, de investimento, comerciais ou de outro tipo fornecidos ou endossados pela TradingView. Leia mais nos Termos de Uso.
Aviso legal
As informações e publicações não se destinam a ser, e não constituem, conselhos ou recomendações financeiras, de investimento, comerciais ou de outro tipo fornecidos ou endossados pela TradingView. Leia mais nos Termos de Uso.