
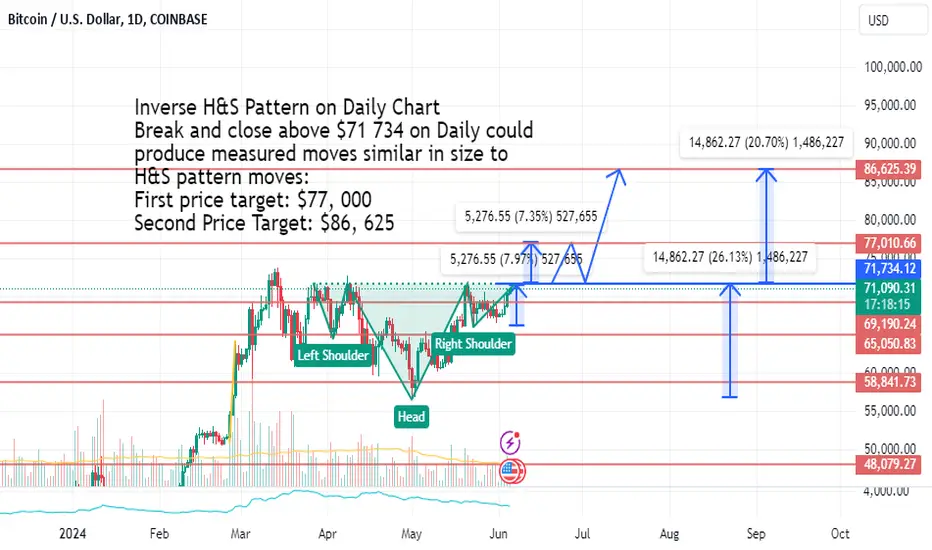
Inverse H&S Pattern is almost completely formed on the Daily Chart.
A Break and close above $71 734 on Daily chart could result in measured moves corresponding with the moves in the Inverse head and shoulder pattern. My prediction: if a Daily close above this level, then we'd see a break upwards to $FWB:77K, retrace back to neckline, and bounce up to $86, 625.
First price target: $77, 000
Second Price Target: $86, 625
Amateur pattern and technical analysis trader. NOT investment advice. Making these posts to document my own journey and thought processes/development on here.
A Break and close above $71 734 on Daily chart could result in measured moves corresponding with the moves in the Inverse head and shoulder pattern. My prediction: if a Daily close above this level, then we'd see a break upwards to $FWB:77K, retrace back to neckline, and bounce up to $86, 625.
First price target: $77, 000
Second Price Target: $86, 625
Amateur pattern and technical analysis trader. NOT investment advice. Making these posts to document my own journey and thought processes/development on here.

Aviso legal
As informações e publicações não se destinam a ser, e não constituem, conselhos ou recomendações financeiras, de investimento, comerciais ou de outro tipo fornecidos ou endossados pela TradingView. Leia mais nos Termos de Uso.
Aviso legal
As informações e publicações não se destinam a ser, e não constituem, conselhos ou recomendações financeiras, de investimento, comerciais ou de outro tipo fornecidos ou endossados pela TradingView. Leia mais nos Termos de Uso.