
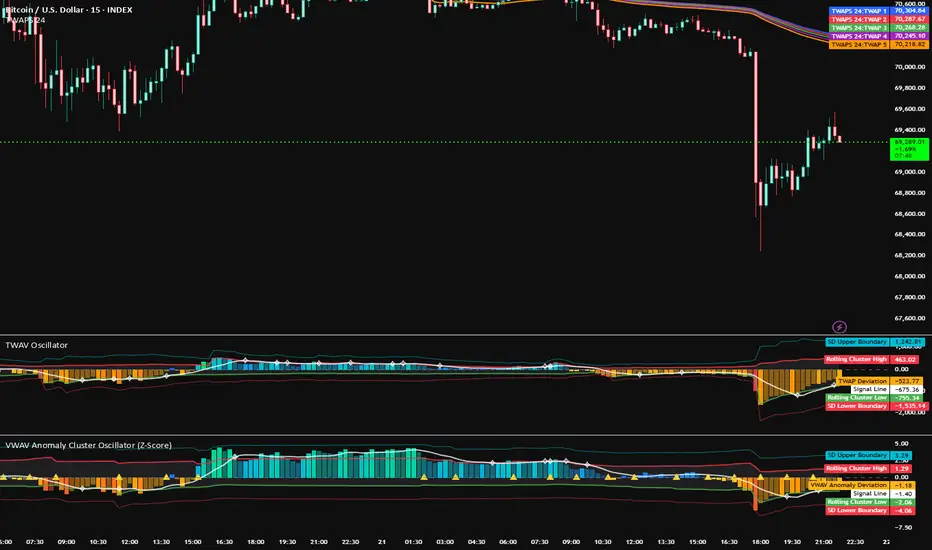
THEORETICAL SYNTHESIS OF THE VWAV AND TWAV CLUSTER METHODOLOGY: A PIONEER ANALYSIS OF INSTITUTIONAL AGREED VALUE AND MARKET EQUILIBRIUM.The evolution of quantitative finance has increasingly moved away from the search for an absolute, static price toward a more nuanced understanding of Value as a dynamic, temporal consensus. This report provides an exhaustive analysis of the VWAV and TWAV Cluster Proposal, a theoretical framework that synthesizes Time-Weighted Agreed Value (TWAV) and Volume-Weighted Agreed Value (VWAV) to approximate institutional cost basis and market equilibrium. By integrating principles of Market Microstructure, Auction Market Theory, and the mechanical mandates of Tier-1 execution desks, this proposal moves beyond simple moving averages to identify a Meta-Mean—a mathematical center of gravity where diverse institutional liquidity cycles intersect.THE POSTULATE OF AGREED VALUE AND THE META-MEAN CONSTRUCT.The foundational hypothesis of this methodology is that market value is not a static point of fact but a moving consensus. In legal and economic theory, the term Agreed Value describes a predetermined valuation shared by participants to ensure stability and predictability in a transaction. When applied to the liquid markets of the 21st century, this concept transforms into a dynamic equilibrium. The market acts as a mechanism designed to facilitate trade at prices where consensus—or Agreement—is reached.Local Value versus Meta-Mean Equilibrium.Individual benchmarks such as a standard Volume-Weighted Average Price (VWAP) or Time-Weighted Average Price (TWAP) provide a Local Value. These lines represent the specific cost basis of an isolated liquidity group at a fixed anchor point, such as the market open or a specific news event. However, the 24-anchor Cluster Proposal suggests that relying on a single anchor is inherently noisy and arbitrary. By generating a dynamic cluster of 24 anchors—each representing a specific temporal or psychological reset—the methodology seeks to identify the Meta-Mean.
[]1. Meta-Mean Definition: The mathematical center of this cluster, functioning as a synthetic Equilibrium.
[]2. Function: Filters out the volatility associated with individual anchor points and reveals the collective gravity of liquidity cycles.- 3. Theory: Draws from the realization that price discovery is a negotiation ending in an agreement on a parameter value, where the stability of that agreement depends on the contractual power and collaboration of the actors involved.
[]Market Value (Standard Price) Characteristics.
[] 1. Stability: Highly volatile and changes with every tick.
[] 2. Calculation: Based on the last traded price or midpoint.
[] 3. Institutional Use: Primarily for short-term speculation and fills.- 4. Risk: Highly susceptible to Liquidity Purges and fake breakouts.
[]Agreed Value (Meta-Mean Cluster) Characteristics.
[] 1. Stability: Highly stable and represents a temporal consensus.
[] 2. Calculation: Computed using a multi-anchor synthetic average Z-Score.
[] 3. Institutional Use: Essential for long-term institutional cost-basis benchmarking and fiduciary Best Execution mandates.- 4. Resilience: Filters noise to identify the True mean.
[]1. Mechanical Withdrawal: This pause represents a mechanical withdrawal of directional pressure.
[]2. Gravity Effect: Without the Smart Money continuing to chase the price higher, the path of least resistance becomes a mean reversion back toward the Agreed Value.- 3. Regulatory Context: Bodies such as the SEC and Monetary Authority of Singapore (MAS) mandate that Best Execution requires firms to obtain the most favorable price possible under prevailing market conditions. This creates a literal gravity toward the Meta-Mean, as the largest participants are structurally prohibited from buying at extended prices.
[]1. Implicit Costs: Market impact and slippage are minimized by trading near the Meta-Mean.
[]2. Benchmark Tracking: Systems monitor deviation from VWAP/TWAP, which the Cluster represents in aggregate.
[]3. Anonymity: Large orders are hidden by breaking them into VWAP/TWAP slices.
[]4. Liquidity Sourcing: Institutions seek Liquidity Purges to fill large blocks.- 5. Time Windowing: Executions are managed through TWAV to ensure temporal distribution.
[]1. Hidden Trends: Shannon’s work identifies that these anchors reveal trends hidden in standard moving averages.
[]2. Continuous Resets: The Cluster Proposal expands this by using 24 anchors to represent a continuous cycle of resets, acknowledging that in a global market, the reset occurs at different times for different liquidity groups.
- []1. Historical Context: The first execution based on VWAP was implemented in 1984 for the Ford Motor Company by James Elkins.
[]2. Requirement vs Choice: At extreme deviations from the mean, market participation shifts from a choice to a requirement for the institutional participant. - 3. Auto-Rebalancing: An institutional participant who has failed to fill their daily mandate must enter the market to rebalance their exposure, creating the mean reversion that the Cluster Proposal seeks to predict.
- []1. Discovery: Steidlmayer postulated that markets auction to find this Value Area.
[]2. Living Boundaries: The Cluster Proposal’s rolling cluster bands function as digital boundaries of such a Value Area, providing a dynamic visualization of the limits of Agreed Value.
[]1. Institutional Requirement: Large institutions require massive counter-party liquidity to fill their orders.
[]2. Accumulation Strategy: To accumulate a long position, they may push price below key support to trigger sell-stops from retail traders, allowing the institution to buy that liquidity at a discount.- 3. Quantitative Signature: The methodology proposes that deep heatmap extremes—visualized through the Z-Score oscillator—serve as a signature of these events, which are deliberate deviations designed to sweep liquidity before a return to value.
[]1. Imbalance: An FVG is an area where price moved too fast in one direction, leaving an imbalance where no two-way trade occurred.
[]2. Efficiency Seeking: Once liquidity is secured, algorithms shift from liquidity-seeking to efficiency-seeking to restore equilibrium.- 3. Rebalancing: The rebalancing algorithm pulls price back toward the Meta-Mean to close these voids and satisfy daily performance benchmarks.
[]1. Low-Degree FVGs: Defined by a slope less than or equal to 0.00015. These reflect smooth, consensus-driven transitions and generate reactions that are 3.2 times stronger than steeper gaps.
[]2. High-Degree FVGs: Defined by a slope greater than 0.0004. These indicate volatile, news-driven spikes or stop hunts and often lead to failed reversals as traders chase price into exhaustion.
- []1. Hypothesis of Agreement (Tight Cluster): When the 24 anchors are tightly packed (low standard deviation), the market is in a state of high consensus. Even a minor price move will result in a significant Z-Score, signaling that the asset is overextended relative to its Agreed Value.
[]2. Hypothesis of Dispersal (Wide Cluster): When the anchors are widely dispersed (high standard deviation), the market is in a state of active price discovery. In this environment, price is given wider technical latitude before an exhaustion signal is considered valid.
[]1. Expansion Phase: The standardized Z-Score histogram enters extreme zones (typically greater than 2 or 3 standard deviations), suggesting price has diverged beyond the cluster's current width.
[]2. Kinetic Exhaustion: The oscillator transitions from aggressive momentum colors to exhaustion colors, indicating the liquidity-seeking phase has concluded.
[]3. The Re-Enveloping Trigger: The signal line re-envelops the histogram bars. This is the moment when the Agreed Value has successfully recaptured the price expansion.
[]4. The Mechanical Pivot: As price re-enters the cluster bands, institutional algorithms pivot back toward Meta-Mean benchmarks, absorbing structural voids left in the wake of the initial move.
[]1. Price Smoothing: By using TWAV instead of an instant valuation, systems ensure that a malicious user cannot easily game the system by temporarily spiking the price to trigger liquidations.
[]2. Temporal Smoothing: This ensures that the Agreed Value represents a sustained consensus over multiple blocks or time periods, rather than a fleeting anomaly.- 3. Arbitrage Risk: Attackers attempting to deviate price from this consensus take on significant arbitrage risk, as they must maintain the artificial price over a sustained window to influence the Meta-Mean.
[]1. Value is Temporal Consensus: Market value is a moving consensus. The intersection of 24 anchors filters the noise of arbitrary resets and reveals the collective gravity of the market.
[]2. Deviation Signals Manipulation: Violent expansions outside cluster bands are likely Engineered Liquidity Purges designed to sweep retail liquidity before a return to Fair Value.
[]3. Standardization is Required:Cross-Sectional Z-Scores allow for objective measurement of Market Disagreement, providing a universal metric for overextension across all asset classes.
[]4. The Rebalancing Pivot: The Re-Enveloping trigger provides a tactical proxy for the moment an algorithmic stop-run terminates and institutional algorithms pivot back toward their daily benchmarks.

Aviso legal
As informações e publicações não se destinam a ser, e não constituem, conselhos ou recomendações financeiras, de investimento, comerciais ou de outro tipo fornecidos ou endossados pela TradingView. Leia mais nos Termos de Uso.
Aviso legal
As informações e publicações não se destinam a ser, e não constituem, conselhos ou recomendações financeiras, de investimento, comerciais ou de outro tipo fornecidos ou endossados pela TradingView. Leia mais nos Termos de Uso.