
The willingness to learn, however, changes everything.
Active traders treat market analysis with an open attitude and they are interested in learning how to analyze the market structure. They combine concepts such as trends, patterns, and support and resistance to actively improve their analysis and trading skills. These traders are real manual traders.
This article is intended for those in the latter group, the learners and active traders. We will explain how you can understand the market with more clarity.
The Market is Fractal of Nature
Does the market move erratically? Or is there an order behind the chaos?
According to the Chaos Theory, the apparent randomness of chaotic complex systems depend on their initial conditions. The concept is not that complicated as it seems: basically the ‘chaotic’ behavior is really not as chaotic as it seems.
Simply said, there are underlying patterns that repeat in a similar way on all scales. This phenomenon can be seen in both natural systems, like weather and climate, and artificial elements like road traffic and economics.
And yes, this includes the financial markets in general. The market is Fractal in nature, which means that similar price patterns repeat on all time frames.
So I started researching fractals a few years ago. Many fractals have worked out, in some cases partially worked out, the study is a process of learning and growth.
I want to share it with you today.
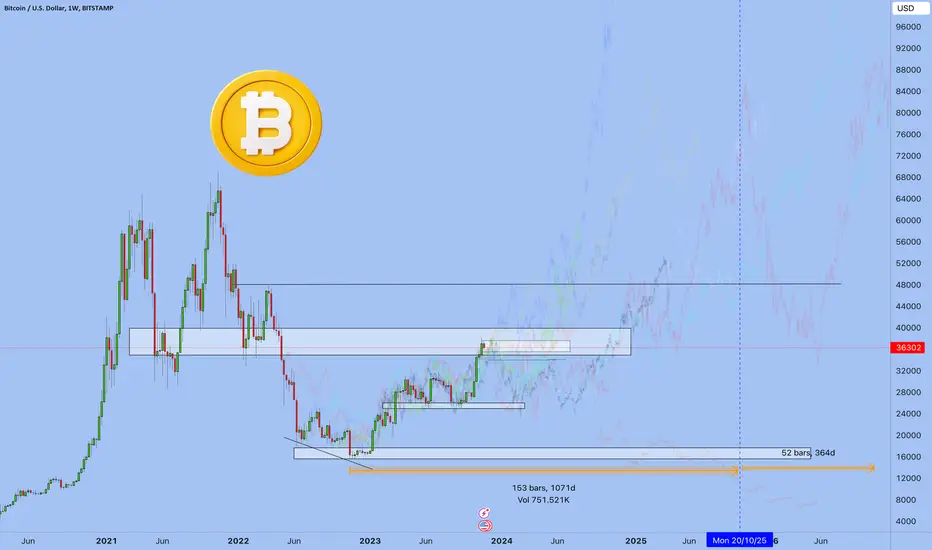
Why it works I have already said in previous posts - because all the same asset managers all the same algorithms all the same emotions and all the same actions people make in this or that situation. The nature of human behavior cannot be deceived. that's why fractals repeat themselves.
I have selected all the structures of reversal and further perspectives of charts
The main indicators :
1. this is the formation of the bottom
2. Holding levels
3. Formation of a horizontal strong level and its breakdown
That's all bitcoin has done in the last year.
What's next?
Statistics I found only one fractal after which we update the bottom.
No rolling growth 4 fractals
And most of them are 20-40 sideways and up.
All fractals are below.


These are all the fractals I want to share with you.
Best Regards EXCAVO
Active traders treat market analysis with an open attitude and they are interested in learning how to analyze the market structure. They combine concepts such as trends, patterns, and support and resistance to actively improve their analysis and trading skills. These traders are real manual traders.
This article is intended for those in the latter group, the learners and active traders. We will explain how you can understand the market with more clarity.
The Market is Fractal of Nature
Does the market move erratically? Or is there an order behind the chaos?
According to the Chaos Theory, the apparent randomness of chaotic complex systems depend on their initial conditions. The concept is not that complicated as it seems: basically the ‘chaotic’ behavior is really not as chaotic as it seems.
Simply said, there are underlying patterns that repeat in a similar way on all scales. This phenomenon can be seen in both natural systems, like weather and climate, and artificial elements like road traffic and economics.
And yes, this includes the financial markets in general. The market is Fractal in nature, which means that similar price patterns repeat on all time frames.
So I started researching fractals a few years ago. Many fractals have worked out, in some cases partially worked out, the study is a process of learning and growth.
I want to share it with you today.
Why it works I have already said in previous posts - because all the same asset managers all the same algorithms all the same emotions and all the same actions people make in this or that situation. The nature of human behavior cannot be deceived. that's why fractals repeat themselves.
I have selected all the structures of reversal and further perspectives of charts
The main indicators :
1. this is the formation of the bottom
2. Holding levels
3. Formation of a horizontal strong level and its breakdown
That's all bitcoin has done in the last year.
What's next?
Statistics I found only one fractal after which we update the bottom.
No rolling growth 4 fractals
And most of them are 20-40 sideways and up.
All fractals are below.
These are all the fractals I want to share with you.
Best Regards EXCAVO
Nota
I see that everyone was very surprised by the 8k, I don't believe in that scenario. 10% probability. I want to be candid and show you everything I found.in my analysis, 151 weeks of growth after a correction.
Nota
Before Black FridayNota
blue fractalNota
Trade ativo
intetesting red fractal
👋 Trading since 2013 · TA & Indicators
TT - trading-tournaments.com/tournaments
Free analysis → t.me/+Qm96gDz3qdyNOs8t
Indicators → excavo.com/
🎓 Get EXCAVO Core,VIP, Academy → t.me/EXCAVOREFF_bot
TT - trading-tournaments.com/tournaments
Free analysis → t.me/+Qm96gDz3qdyNOs8t
Indicators → excavo.com/
🎓 Get EXCAVO Core,VIP, Academy → t.me/EXCAVOREFF_bot
Aviso legal
As informações e publicações não se destinam a ser, e não constituem, conselhos ou recomendações financeiras, de investimento, comerciais ou de outro tipo fornecidos ou endossados pela TradingView. Leia mais nos Termos de Uso.
👋 Trading since 2013 · TA & Indicators
TT - trading-tournaments.com/tournaments
Free analysis → t.me/+Qm96gDz3qdyNOs8t
Indicators → excavo.com/
🎓 Get EXCAVO Core,VIP, Academy → t.me/EXCAVOREFF_bot
TT - trading-tournaments.com/tournaments
Free analysis → t.me/+Qm96gDz3qdyNOs8t
Indicators → excavo.com/
🎓 Get EXCAVO Core,VIP, Academy → t.me/EXCAVOREFF_bot
Aviso legal
As informações e publicações não se destinam a ser, e não constituem, conselhos ou recomendações financeiras, de investimento, comerciais ou de outro tipo fornecidos ou endossados pela TradingView. Leia mais nos Termos de Uso.