
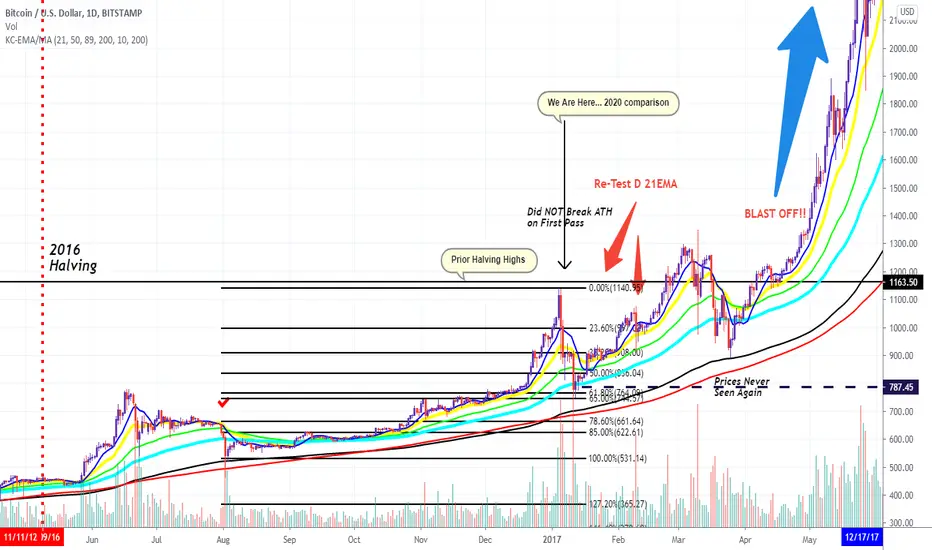
Retro Chart I've been posting and its hitting similarities in 2020. Just hit the Daily 21 EMA, might test the Daily 89 EMA...didn't test Weekly 21 EMA unitl January 2017, but by then...the Dip to the 21 Daily EMA was still Lower than the Januaru Dip...Prices Never Seen Again...
Nota
Thanks for all the Likes and comments, follow my feed and we'll refer to this chart for the next year adding to it and compare the past and current Bull Runs
Aviso legal
As informações e publicações não se destinam a ser, e não constituem, conselhos ou recomendações financeiras, de investimento, comerciais ou de outro tipo fornecidos ou endossados pela TradingView. Leia mais nos Termos de Uso.
Aviso legal
As informações e publicações não se destinam a ser, e não constituem, conselhos ou recomendações financeiras, de investimento, comerciais ou de outro tipo fornecidos ou endossados pela TradingView. Leia mais nos Termos de Uso.