
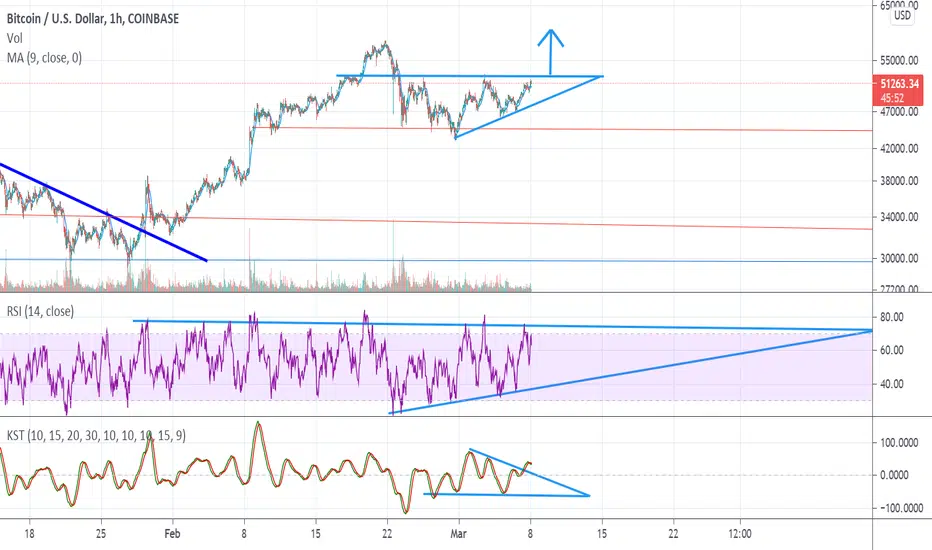
After breaking out from a crude bullish flag or what could have been considered a descending triangle linked to this post, BTC has consolidated into an Ascending Triangle drawn in light blue.
On the RSI there is a similar pattern as the price action, notice the series of higher lows along with the blue upward sloping support of the Ascending Triangle.
On the KST there's been a breakout of potentially a bullish flag pattern on a macro level, on a micro time frame there's been a bearish cross displaying the red line crossing over downward of the green line.
On the RSI there is a similar pattern as the price action, notice the series of higher lows along with the blue upward sloping support of the Ascending Triangle.
On the KST there's been a breakout of potentially a bullish flag pattern on a macro level, on a micro time frame there's been a bearish cross displaying the red line crossing over downward of the green line.

Publicações relacionadas
Aviso legal
As informações e publicações não se destinam a ser, e não constituem, conselhos ou recomendações financeiras, de investimento, comerciais ou de outro tipo fornecidos ou endossados pela TradingView. Leia mais nos Termos de Uso.
Publicações relacionadas
Aviso legal
As informações e publicações não se destinam a ser, e não constituem, conselhos ou recomendações financeiras, de investimento, comerciais ou de outro tipo fornecidos ou endossados pela TradingView. Leia mais nos Termos de Uso.