
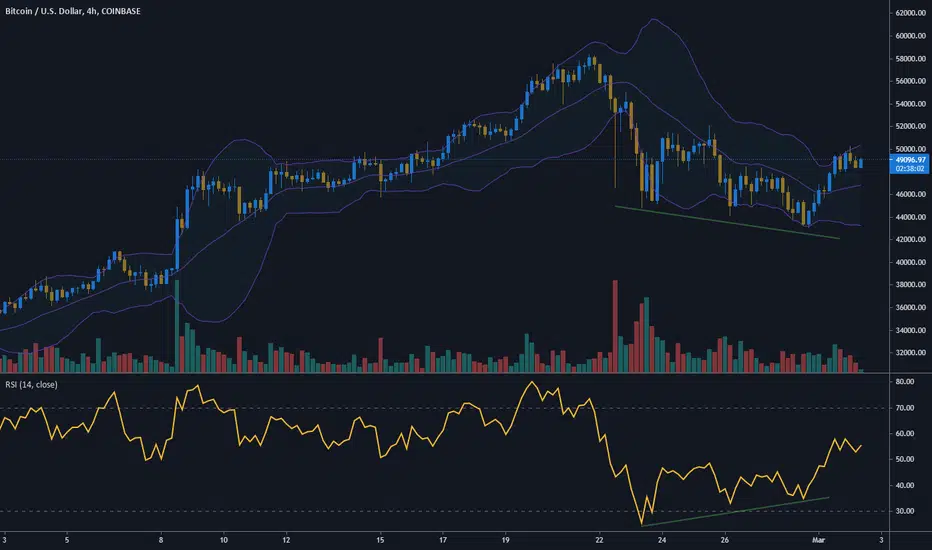
On the 4 hours chart, there is a divergence between the price and the RSI.
The price is doing lower lows but the RSI is doing higher lows.
In every new low, the price penetrates less and less the lower bollinger band.
Bullish.
The price is doing lower lows but the RSI is doing higher lows.
In every new low, the price penetrates less and less the lower bollinger band.
Bullish.

Aviso legal
As informações e publicações não se destinam a ser, e não constituem, conselhos ou recomendações financeiras, de investimento, comerciais ou de outro tipo fornecidos ou endossados pela TradingView. Leia mais nos Termos de Uso.
Aviso legal
As informações e publicações não se destinam a ser, e não constituem, conselhos ou recomendações financeiras, de investimento, comerciais ou de outro tipo fornecidos ou endossados pela TradingView. Leia mais nos Termos de Uso.