
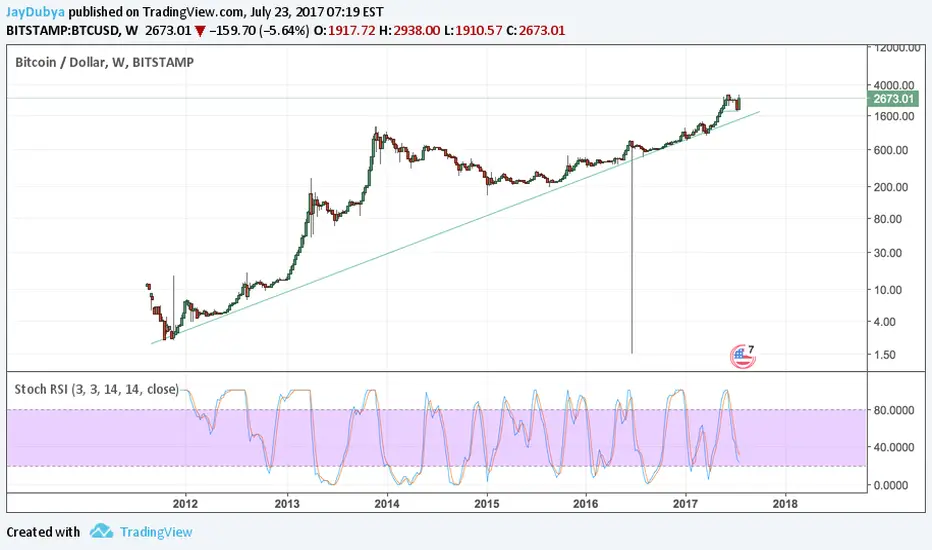
I have shown Bitcoin all the way back to 2012 on a log plot. On a log plot, a straight line represents exponential growth.
The green line here is a growth rate of 3.8X per year. Notice that this is an extremely strong support line.
Even when looking at the daily and hourly charts, I use this chart to evaluate the position of bitcoin on a long term scale. While we are currently slightly above this line, we are no where near as far as we were in 2013! If this support continues, expect Bitcoin to reach $5000 by July/Aug 2018.
The green line here is a growth rate of 3.8X per year. Notice that this is an extremely strong support line.
Even when looking at the daily and hourly charts, I use this chart to evaluate the position of bitcoin on a long term scale. While we are currently slightly above this line, we are no where near as far as we were in 2013! If this support continues, expect Bitcoin to reach $5000 by July/Aug 2018.

Aviso legal
As informações e publicações não se destinam a ser, e não constituem, conselhos ou recomendações financeiras, de investimento, comerciais ou de outro tipo fornecidos ou endossados pela TradingView. Leia mais nos Termos de Uso.
Aviso legal
As informações e publicações não se destinam a ser, e não constituem, conselhos ou recomendações financeiras, de investimento, comerciais ou de outro tipo fornecidos ou endossados pela TradingView. Leia mais nos Termos de Uso.