
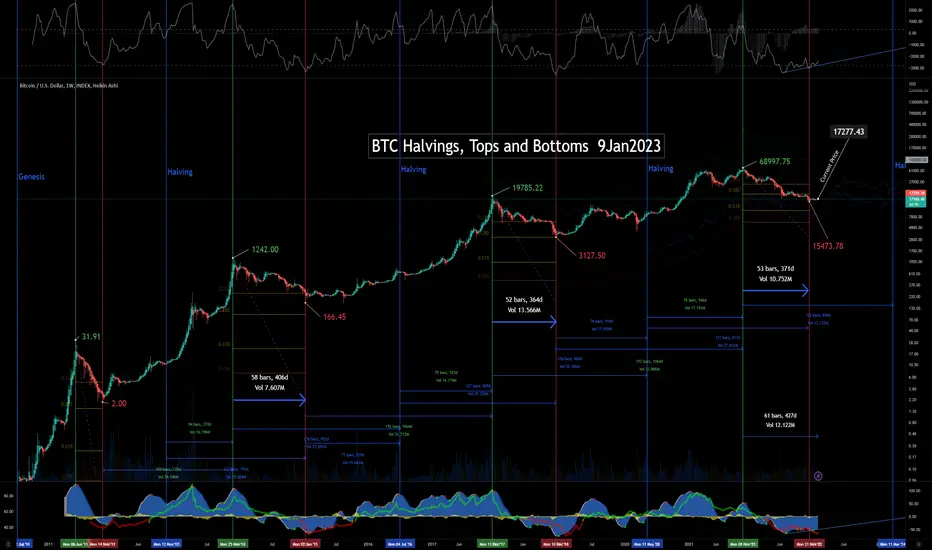
Latest update of an X-axis chart. Prices labeled for all cycle tops and bottoms. Dates marked for tops, bottoms and halvings.
Could easily see a 2x of previous ATH in 2025. Expecting slow trend upward with volatility increasing into the halving/ Fed pivot, then a parabolic 5-wave run up above 100k in 2025.
This version also includes time measurements of relevant cycle relationships.
Could easily see a 2x of previous ATH in 2025. Expecting slow trend upward with volatility increasing into the halving/ Fed pivot, then a parabolic 5-wave run up above 100k in 2025.
This version also includes time measurements of relevant cycle relationships.

Aviso legal
As informações e publicações não se destinam a ser, e não constituem, conselhos ou recomendações financeiras, de investimento, comerciais ou de outro tipo fornecidos ou endossados pela TradingView. Leia mais nos Termos de Uso.
Aviso legal
As informações e publicações não se destinam a ser, e não constituem, conselhos ou recomendações financeiras, de investimento, comerciais ou de outro tipo fornecidos ou endossados pela TradingView. Leia mais nos Termos de Uso.