
1. Price Structure & Trend
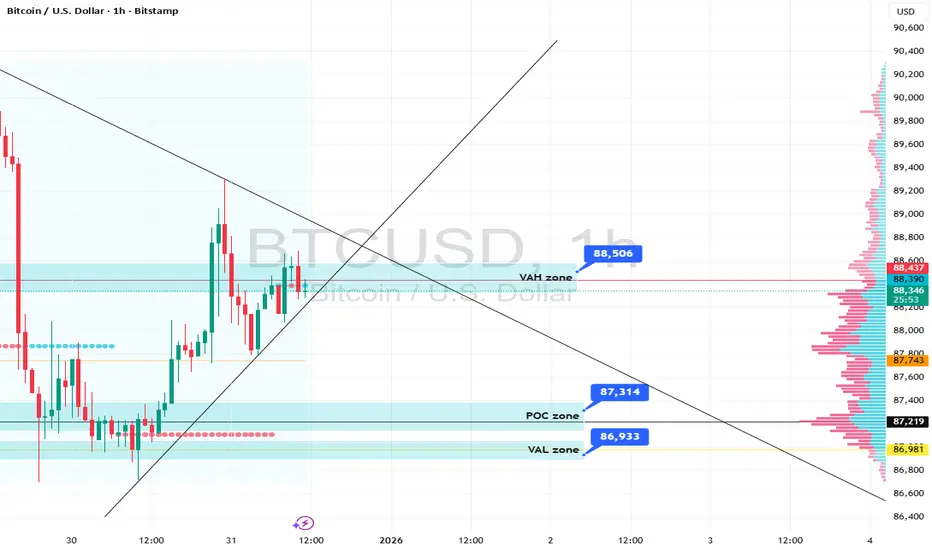
Symmetrical Triangle Pattern: The price is currently compressing tightly within a triangle formed by a descending trendline from above and an ascending trendline from below.
Current State: Trading at 88,428, the price is sitting right at the upper boundary of the triangle and the VAH resistance. This is a high-tension zone, signaling an imminent breakout.
2. Volume Profile Analysis
Liquidity zones are clearly defined on the chart:
VAH Zone (88,506): This is the "Value Area High." The price is currently reacting here. A decisive break above this level would mean BTC has exited its accumulation phase, likely heading toward 90,000+.
POC Zone (87,314): The "Point of Control" (highest volume) sits below current prices. This acts as a primary magnet and support floor; if a correction occurs, buyers are expected to step in here.
VAL Zone (86,933): The "Value Area Low" serves as the final line of defense for the current bullish structure.
3. Potential Scenarios
Bullish Breakout: If an hourly candle closes firmly above 88,500 and the descending trendline, the uptrend is confirmed. Short-term targets would be the previous highs around 90,000 - 90,400.
Rejection/Correction: If the price fails to break the VAH and drops below the ascending trendline, it will likely seek liquidity at the POC (87,314) before making its next move.
💡 Tactical Summary:
The market is in a "Wait for Confirmation" state.
Bulls: Have a slight edge as they continue to maintain higher lows (the rising trendline).
Bears: Are putting up a strong fight to defend the 88,500 psychological level.
Strategy: It is best to wait for a clear candle close outside of the triangle. Entering exactly at the "apex" (the tip) of the triangle carries a high risk of being caught in a "fakeout" or stop-loss hunt.
Symmetrical Triangle Pattern: The price is currently compressing tightly within a triangle formed by a descending trendline from above and an ascending trendline from below.
Current State: Trading at 88,428, the price is sitting right at the upper boundary of the triangle and the VAH resistance. This is a high-tension zone, signaling an imminent breakout.
2. Volume Profile Analysis
Liquidity zones are clearly defined on the chart:
VAH Zone (88,506): This is the "Value Area High." The price is currently reacting here. A decisive break above this level would mean BTC has exited its accumulation phase, likely heading toward 90,000+.
POC Zone (87,314): The "Point of Control" (highest volume) sits below current prices. This acts as a primary magnet and support floor; if a correction occurs, buyers are expected to step in here.
VAL Zone (86,933): The "Value Area Low" serves as the final line of defense for the current bullish structure.
3. Potential Scenarios
Bullish Breakout: If an hourly candle closes firmly above 88,500 and the descending trendline, the uptrend is confirmed. Short-term targets would be the previous highs around 90,000 - 90,400.
Rejection/Correction: If the price fails to break the VAH and drops below the ascending trendline, it will likely seek liquidity at the POC (87,314) before making its next move.
💡 Tactical Summary:
The market is in a "Wait for Confirmation" state.
Bulls: Have a slight edge as they continue to maintain higher lows (the rising trendline).
Bears: Are putting up a strong fight to defend the 88,500 psychological level.
Strategy: It is best to wait for a clear candle close outside of the triangle. Entering exactly at the "apex" (the tip) of the triangle carries a high risk of being caught in a "fakeout" or stop-loss hunt.

Publicações relacionadas
Aviso legal
As informações e publicações não se destinam a ser, e não constituem, conselhos ou recomendações financeiras, de investimento, comerciais ou de outro tipo fornecidos ou endossados pela TradingView. Leia mais nos Termos de Uso.
Publicações relacionadas
Aviso legal
As informações e publicações não se destinam a ser, e não constituem, conselhos ou recomendações financeiras, de investimento, comerciais ou de outro tipo fornecidos ou endossados pela TradingView. Leia mais nos Termos de Uso.