
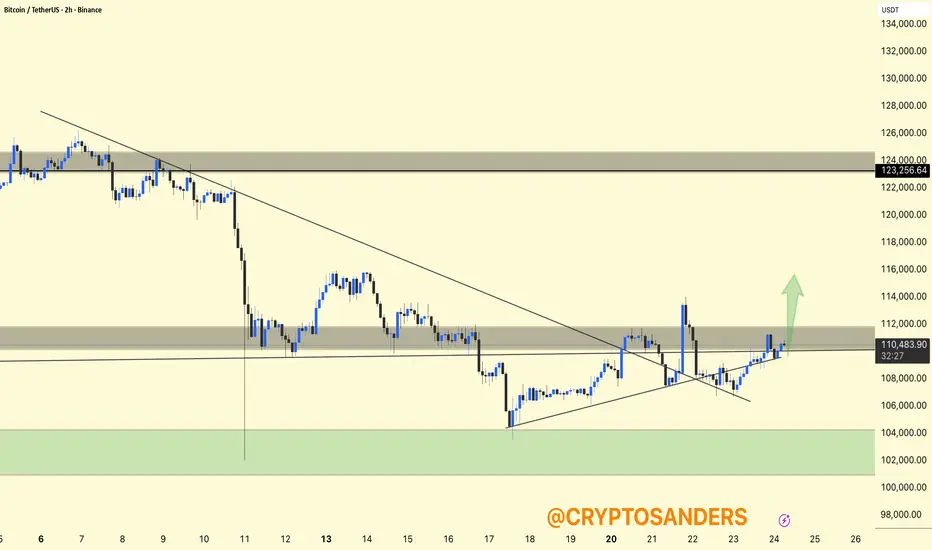
BTCUSDT Chart Analysis (2H).
Breakout: BTC has broken its descending trendline and reclaimed the $110,000 resistance area. Bulls are pushing the price towards the upper side of the supply zone marked around $112,000.
Setup: If BTC maintains a price above $110,000, the chart forecasts further upside, with the next resistance level at $115,000-$117,000.
Caution: Support is at $108,000-$110,000; losing this level could risk a retracement to $106,000-$104,000.
DYOR | NFA
Breakout: BTC has broken its descending trendline and reclaimed the $110,000 resistance area. Bulls are pushing the price towards the upper side of the supply zone marked around $112,000.
Setup: If BTC maintains a price above $110,000, the chart forecasts further upside, with the next resistance level at $115,000-$117,000.
Caution: Support is at $108,000-$110,000; losing this level could risk a retracement to $106,000-$104,000.
DYOR | NFA

Publicações relacionadas
Aviso legal
As informações e publicações não se destinam a ser, e não constituem, conselhos ou recomendações financeiras, de investimento, comerciais ou de outro tipo fornecidos ou endossados pela TradingView. Leia mais nos Termos de Uso.
Publicações relacionadas
Aviso legal
As informações e publicações não se destinam a ser, e não constituem, conselhos ou recomendações financeiras, de investimento, comerciais ou de outro tipo fornecidos ou endossados pela TradingView. Leia mais nos Termos de Uso.