
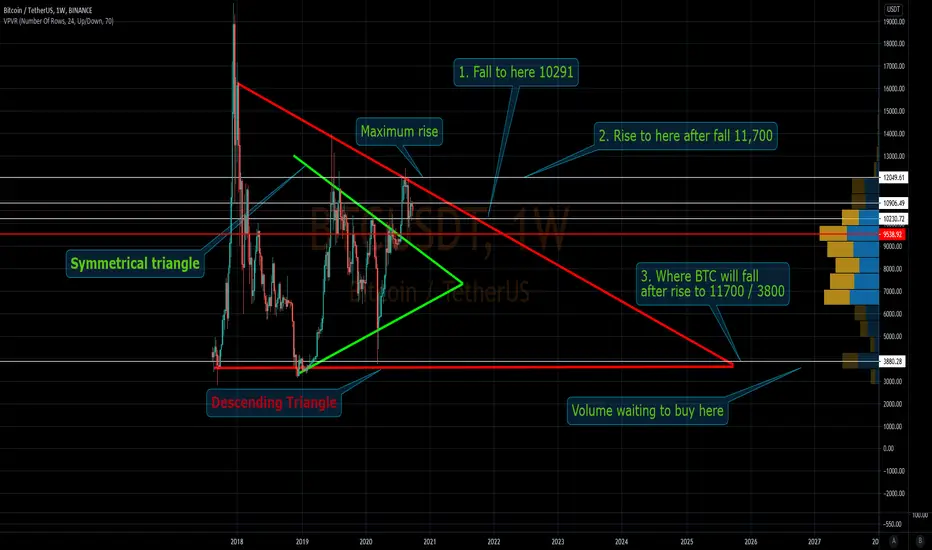
If this idea plays out like this it is going to be another repeat of the march fall to 3,500. In the short term we are looking at a drop to 10291 with a rise following that will take it to 11,700-12,000. We can see there is volume waiting on the books at that level which can only mean one thing. We have a symmetrical triangle within the overall pattern of a descending triangle. I have tossed this around a lot and this makes the most sense.
Do you agree? Comment what your thoughts are on this scenario and if you think that it is a viable pattern.
If you like my content throw me a like and follow for more updates as more data comes in. I appreciate the support!
Do you agree? Comment what your thoughts are on this scenario and if you think that it is a viable pattern.
If you like my content throw me a like and follow for more updates as more data comes in. I appreciate the support!
Nota
Well this symmetrical triangle continued pumping here and unless it proves to be a premature breakout which I doubt this will do we got a good deal of upside to look forward to as on the month chart we are just out of the triangle
Aviso legal
As informações e publicações não se destinam a ser, e não constituem, conselhos ou recomendações financeiras, de investimento, comerciais ou de outro tipo fornecidos ou endossados pela TradingView. Leia mais nos Termos de Uso.
Aviso legal
As informações e publicações não se destinam a ser, e não constituem, conselhos ou recomendações financeiras, de investimento, comerciais ou de outro tipo fornecidos ou endossados pela TradingView. Leia mais nos Termos de Uso.