
Good afternoon my dear friend, reader, supporter and follower, it is my pleasure to write again for you today.
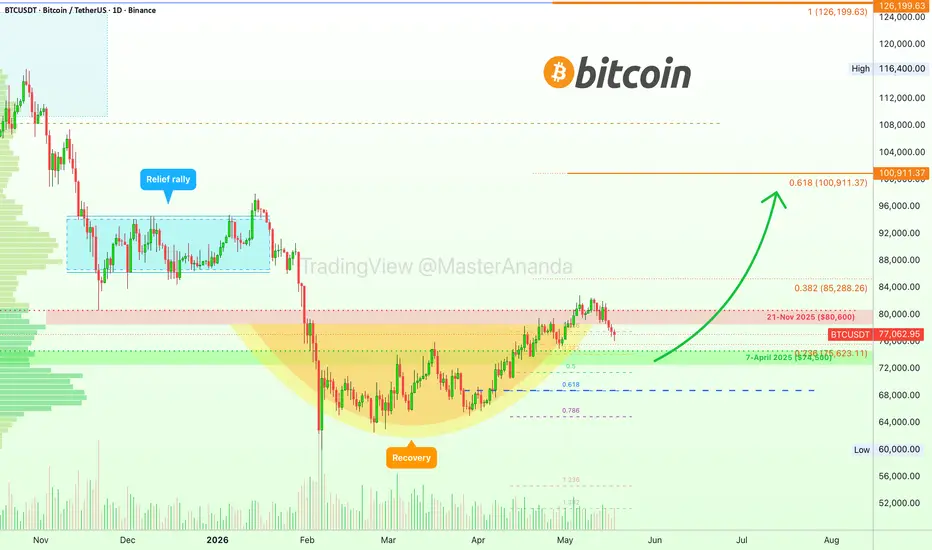
I am looking at the chart on Bitcoin daily trying to figure out what it has to say. A sharp retrace so far, not the usual type of pattern. The candles move straight down but continue to cover little space.
As a positive bit of news, the retrace started technically twelve days ago. After twelve days, the low is $76,000 which is a super strong price.
The duration is good news because retraces tend to last 2-3 weeks at the most. It truly depends on the duration of the preceding bullish move. Since growth happened for some 40 days without a pause, 14-21 days of a retrace can be considered normal. 21 days sounds/read/feels like a lot right now, so maybe less.
The shape points to a swift recovery, a bullish resumption. So far, the chart does not support a new bear market nor major crash. So far though, things can change.
The current chart simply shows a cool-off period which is as normal as it gets. This period can be used as an opportunity to regain strength, to balance positions and make adjustment, growth is expected to resume within days.
One is the chart, the other is my personal opinion and prediction.
The chart: The bullish bias that developed after the 6-February low remains intact and right now it is hyper strong. For this bullish structure to become nullified, invalidated, Bitcoin needs to break and close below $64,000 on the daily and weekly timeframes. If this event does not happen, you know the bulls have the upper-hand.
My opinion (prediction): Bitcoin continues growing after the retrace ends—a higher low. The duration of the retrace can vary but so far the bears are weak at best. Remember, market conditions can change but nobody cares.
Namaste.
I am looking at the chart on Bitcoin daily trying to figure out what it has to say. A sharp retrace so far, not the usual type of pattern. The candles move straight down but continue to cover little space.
As a positive bit of news, the retrace started technically twelve days ago. After twelve days, the low is $76,000 which is a super strong price.
The duration is good news because retraces tend to last 2-3 weeks at the most. It truly depends on the duration of the preceding bullish move. Since growth happened for some 40 days without a pause, 14-21 days of a retrace can be considered normal. 21 days sounds/read/feels like a lot right now, so maybe less.
The shape points to a swift recovery, a bullish resumption. So far, the chart does not support a new bear market nor major crash. So far though, things can change.
The current chart simply shows a cool-off period which is as normal as it gets. This period can be used as an opportunity to regain strength, to balance positions and make adjustment, growth is expected to resume within days.
One is the chart, the other is my personal opinion and prediction.
The chart: The bullish bias that developed after the 6-February low remains intact and right now it is hyper strong. For this bullish structure to become nullified, invalidated, Bitcoin needs to break and close below $64,000 on the daily and weekly timeframes. If this event does not happen, you know the bulls have the upper-hand.
My opinion (prediction): Bitcoin continues growing after the retrace ends—a higher low. The duration of the retrace can vary but so far the bears are weak at best. Remember, market conditions can change but nobody cares.
Namaste.
Trade ativo
We all know pretty well how Bitcoin works; when it is set to crash it crashes, when it is set to grow it grows.Bitcoin has been growing for a long period of time, more than 100 days. The last bullish move alone lasted some 40 days. After two weeks of bearish action, no signs of a major drop. This reveals we are witnessing a pause, a retrace rather than a new bearish impulse. This also reveals we will get additional growth. It is very simple. Patience is the best possible choice right now coupled with buy and hold. Selling is a big mistake. Why? Because the bottom happened more than three months ago.
Namaste.
Trade fechado: objetivo atingido
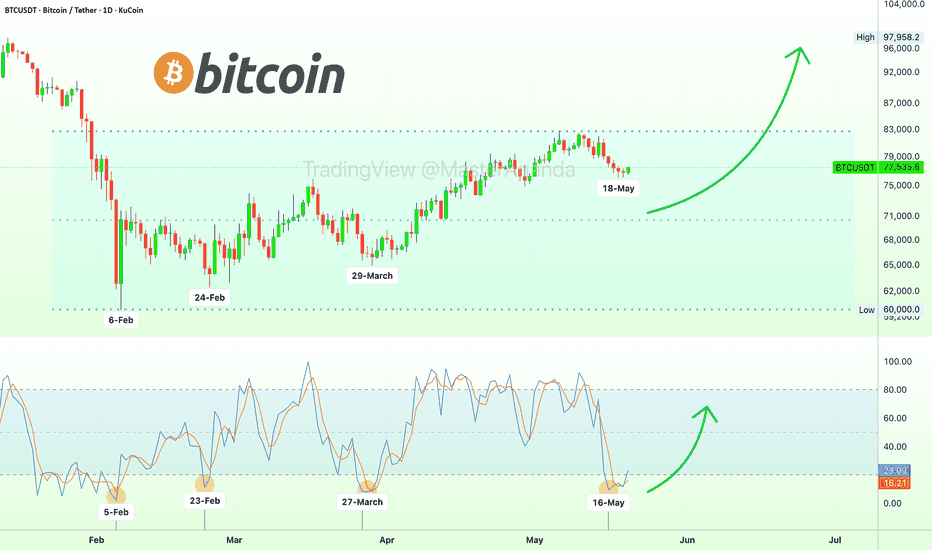
The move today above $78,000 can be taken as an early call signaling the retrace being over. With the retrace over, we get a bullish resumption. This resumption must end in a higher high due to the small size of the retrace, a very strong higher high. With the current chart setup, we are talking about ~$100,000 next, can be right below this level.Bitcoin grew from 29-March through 6-May, more than a month. The same signal that started that wave is starting this new one, it is based on the stochastic. See below:
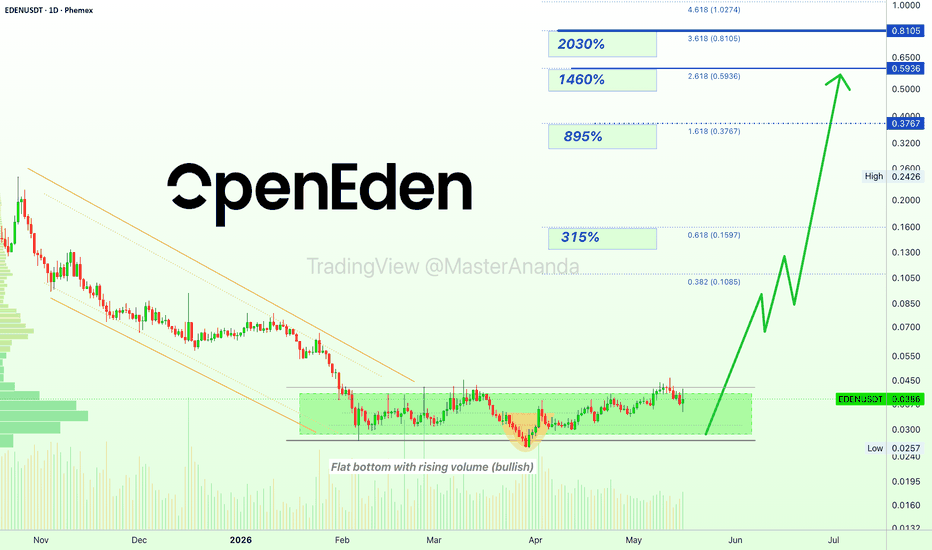
The strong reaction on the altcoins clearly reveals will be seeing sustained long-term growth.
Namaste.

Trading Cryptocurrencies can be the hardest undertaking ever without the right trade-numbers, without accurate private-access information. Free is free, but the best always requires sweat, an investment. Since 2017 👇
t.me/masteranandatrades/8778
t.me/masteranandatrades/8778
Publicações relacionadas
Aviso legal
As informações e publicações não se destinam a ser, e não constituem, conselhos ou recomendações financeiras, de investimento, comerciais ou de outro tipo fornecidos ou endossados pela TradingView. Leia mais nos Termos de Uso.
Trading Cryptocurrencies can be the hardest undertaking ever without the right trade-numbers, without accurate private-access information. Free is free, but the best always requires sweat, an investment. Since 2017 👇
t.me/masteranandatrades/8778
t.me/masteranandatrades/8778
Publicações relacionadas
Aviso legal
As informações e publicações não se destinam a ser, e não constituem, conselhos ou recomendações financeiras, de investimento, comerciais ou de outro tipo fornecidos ou endossados pela TradingView. Leia mais nos Termos de Uso.