
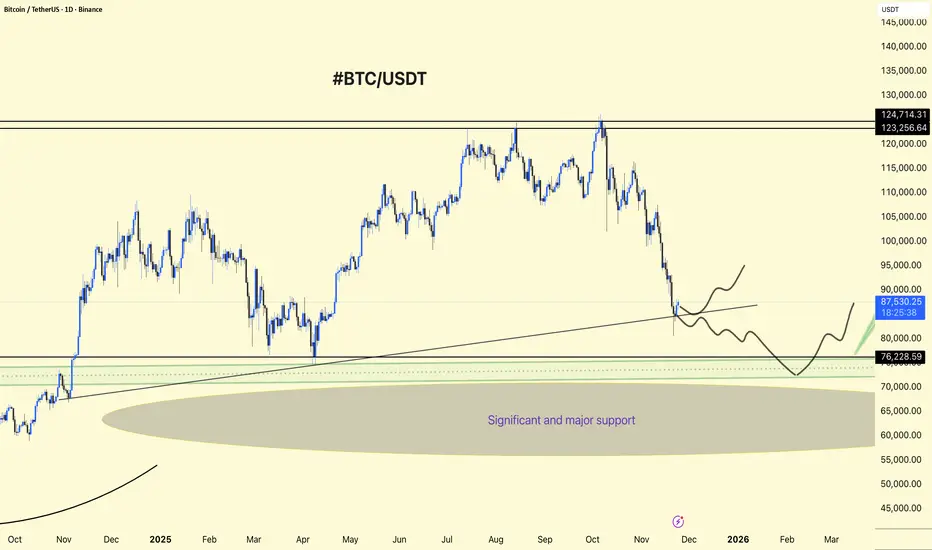
Bitcoin (BTCUSDT) is currently approaching a major support zone between $76,000 and $80,000. The chart shows two possible scenarios:
If support holds, a rally to $90,000 or above is possible, continuing the overall long-term bullish trend.
If support breaks, a downward move is likely to retest the lower support zone before any major recovery move can begin.
The chart suggests that this area is crucial; the next major action depends on how the price reacts to this support zone.
DYOR | NFA
If support holds, a rally to $90,000 or above is possible, continuing the overall long-term bullish trend.
If support breaks, a downward move is likely to retest the lower support zone before any major recovery move can begin.
The chart suggests that this area is crucial; the next major action depends on how the price reacts to this support zone.
DYOR | NFA

Publicações relacionadas
Aviso legal
As informações e publicações não se destinam a ser, e não constituem, conselhos ou recomendações financeiras, de investimento, comerciais ou de outro tipo fornecidos ou endossados pela TradingView. Leia mais nos Termos de Uso.
Publicações relacionadas
Aviso legal
As informações e publicações não se destinam a ser, e não constituem, conselhos ou recomendações financeiras, de investimento, comerciais ou de outro tipo fornecidos ou endossados pela TradingView. Leia mais nos Termos de Uso.