
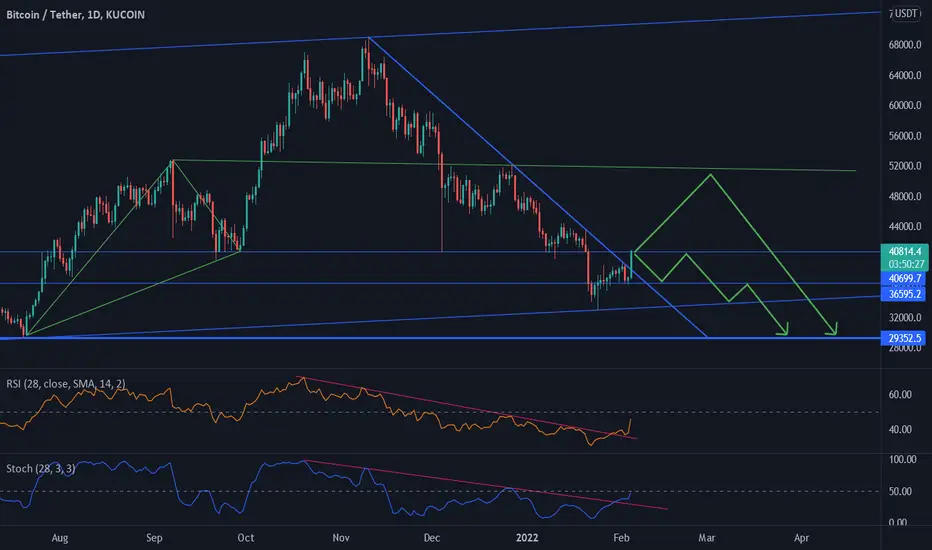
Bitcoin went almost according to the previous analysis. Now, the downtrend line is broken along with RSI and Stochastic indicators’ downtrend line. The candle that broke the downtrend line is a strong one and shows that the coming uptrend will probably be strong. However, the 30K area which is a strong magnet area still could pull Bitcoin down. Moreover, if Bitcoin goes up, there is a high possibility that a mirror triangle pattern (like the one on the chart) occurs, and Bitcoin bounces from the green horizontal line.

Publicações relacionadas
Aviso legal
As informações e publicações não se destinam a ser, e não constituem, conselhos ou recomendações financeiras, de investimento, comerciais ou de outro tipo fornecidos ou endossados pela TradingView. Leia mais nos Termos de Uso.
Publicações relacionadas
Aviso legal
As informações e publicações não se destinam a ser, e não constituem, conselhos ou recomendações financeiras, de investimento, comerciais ou de outro tipo fornecidos ou endossados pela TradingView. Leia mais nos Termos de Uso.