
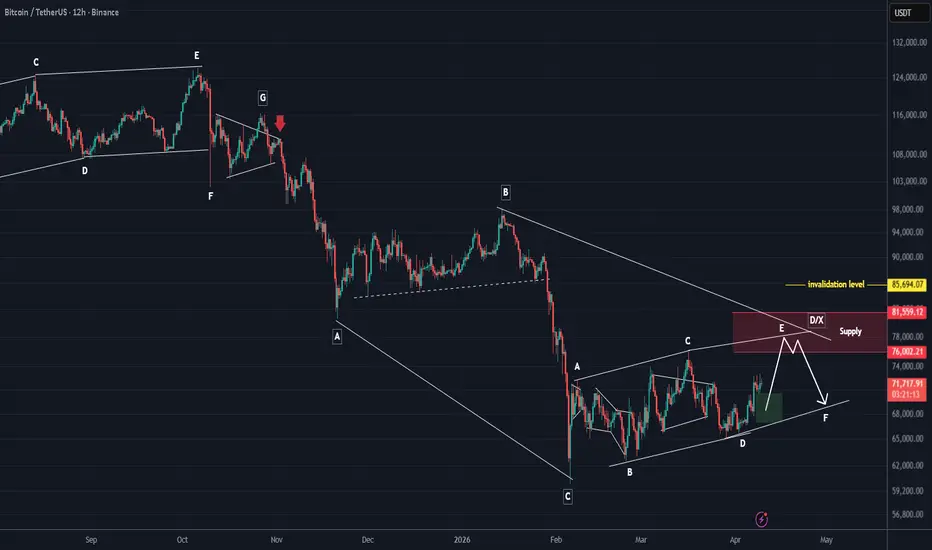
Since the point where the red arrow was placed on the chart, Bitcoin’s bullish phase on higher timeframes has ended, and the market has entered a bearish phase.
The bearish phase is either forming an ABC structure with an X wave, where we are currently in wave X, or a diametric pattern, where price is now in wave D.
For a proper bearish structure to develop, it is preferable for price to reach the red marked zone.
Bitcoin’s movements are slow and exhausting, and in such conditions it tends to cause the most losses for impatient traders.
If the identified diametric structure for wave D/X is correct, the best area for the completion of wave E of this pattern is the red zone.
As you know, the market currently lacks confidence in Bitcoin’s bullish moves, which is why strong impulsive upside movements are not forming.
Stay with us for the next Bitcoin updates so you don’t miss the upcoming developments.
If you have a coin or altcoin you want analyzed, first hit the like button and then comment its name so I can review it for you.
Do you also think BITCOIN is bullish?
The bearish phase is either forming an ABC structure with an X wave, where we are currently in wave X, or a diametric pattern, where price is now in wave D.
For a proper bearish structure to develop, it is preferable for price to reach the red marked zone.
Bitcoin’s movements are slow and exhausting, and in such conditions it tends to cause the most losses for impatient traders.
If the identified diametric structure for wave D/X is correct, the best area for the completion of wave E of this pattern is the red zone.
As you know, the market currently lacks confidence in Bitcoin’s bullish moves, which is why strong impulsive upside movements are not forming.
Stay with us for the next Bitcoin updates so you don’t miss the upcoming developments.
If you have a coin or altcoin you want analyzed, first hit the like button and then comment its name so I can review it for you.
Do you also think BITCOIN is bullish?
Trade ativo
The price pumped over 11% after hitting the green zone and reached the red box.When everyone was bearish on Bitcoin, we were bullish.

🔥 Don't Just Watch the Market. Understand It!
📊 Crypto Analysis & Setups:
👉 t.me/Behdark_EN
💹 Forex Analysis & Setups:
👉 t.me/FX_Behdark
🚀 Join BehDark for Market Insights, Trading Setups & Key Levels. Choose Your Market & Join Us!
📊 Crypto Analysis & Setups:
👉 t.me/Behdark_EN
💹 Forex Analysis & Setups:
👉 t.me/FX_Behdark
🚀 Join BehDark for Market Insights, Trading Setups & Key Levels. Choose Your Market & Join Us!
Aviso legal
As informações e publicações não se destinam a ser, e não constituem, conselhos ou recomendações financeiras, de investimento, comerciais ou de outro tipo fornecidos ou endossados pela TradingView. Leia mais nos Termos de Uso.
🔥 Don't Just Watch the Market. Understand It!
📊 Crypto Analysis & Setups:
👉 t.me/Behdark_EN
💹 Forex Analysis & Setups:
👉 t.me/FX_Behdark
🚀 Join BehDark for Market Insights, Trading Setups & Key Levels. Choose Your Market & Join Us!
📊 Crypto Analysis & Setups:
👉 t.me/Behdark_EN
💹 Forex Analysis & Setups:
👉 t.me/FX_Behdark
🚀 Join BehDark for Market Insights, Trading Setups & Key Levels. Choose Your Market & Join Us!
Aviso legal
As informações e publicações não se destinam a ser, e não constituem, conselhos ou recomendações financeiras, de investimento, comerciais ou de outro tipo fornecidos ou endossados pela TradingView. Leia mais nos Termos de Uso.