
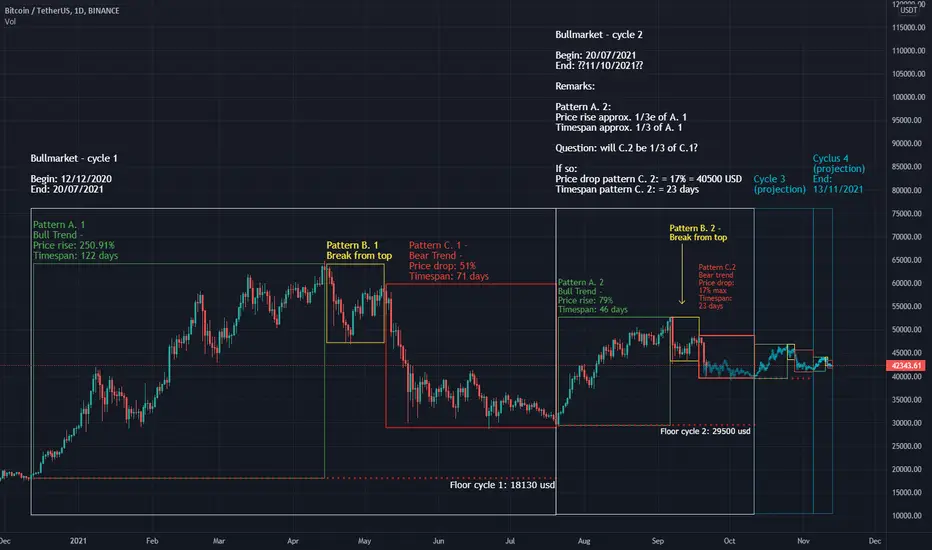
This analysis highlights the patterns that repeat on the daily BTC-USDT chart, and projects what were to happen if these patterns were to keep repeating.
It shows the emergence of a symmetrical wedge.
This leads to a second chart, illustrating the symmetrical wedge poised for breakout second half of November to a top of 90.000 USD / BTC. It is linked as a related idea.
It shows the emergence of a symmetrical wedge.
This leads to a second chart, illustrating the symmetrical wedge poised for breakout second half of November to a top of 90.000 USD / BTC. It is linked as a related idea.

Aviso legal
As informações e publicações não se destinam a ser, e não constituem, conselhos ou recomendações financeiras, de investimento, comerciais ou de outro tipo fornecidos ou endossados pela TradingView. Leia mais nos Termos de Uso.
Aviso legal
As informações e publicações não se destinam a ser, e não constituem, conselhos ou recomendações financeiras, de investimento, comerciais ou de outro tipo fornecidos ou endossados pela TradingView. Leia mais nos Termos de Uso.