
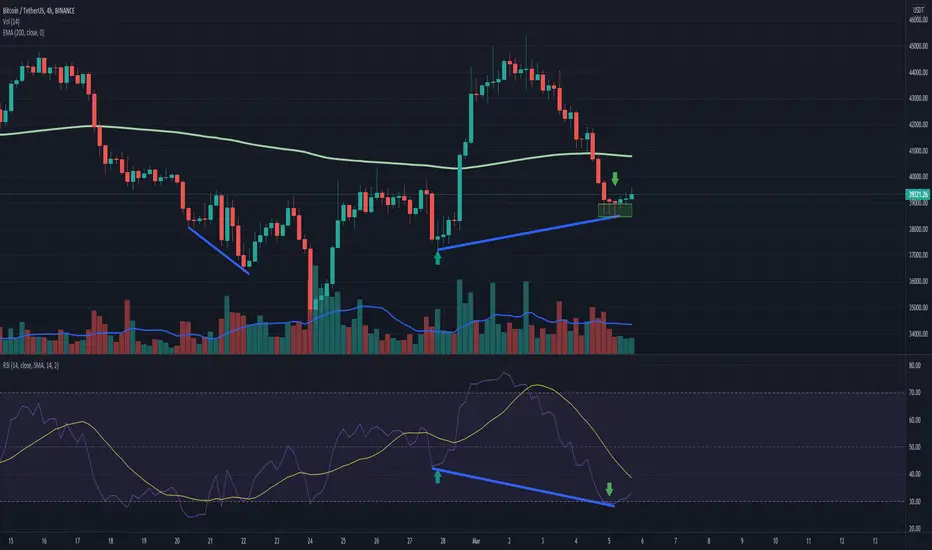
As you can see on the chart we got a lower low and after that we get to see a higher low.
On the RSI we get a higher low on the lowe low and lower low on the higher low, this usually indicates a bullish pattern.
RSI is overbought on the 4 hour chart.
Strong demand levels confirmed.
I don't know what else to say more than I think this is a great buying opportunity, of course I could be wrong.
Not financial advice.
I hope this was useful to someone and good luck!
On the RSI we get a higher low on the lowe low and lower low on the higher low, this usually indicates a bullish pattern.
RSI is overbought on the 4 hour chart.
Strong demand levels confirmed.
I don't know what else to say more than I think this is a great buying opportunity, of course I could be wrong.
Not financial advice.
I hope this was useful to someone and good luck!

Aviso legal
As informações e publicações não se destinam a ser, e não constituem, conselhos ou recomendações financeiras, de investimento, comerciais ou de outro tipo fornecidos ou endossados pela TradingView. Leia mais nos Termos de Uso.
Aviso legal
As informações e publicações não se destinam a ser, e não constituem, conselhos ou recomendações financeiras, de investimento, comerciais ou de outro tipo fornecidos ou endossados pela TradingView. Leia mais nos Termos de Uso.