
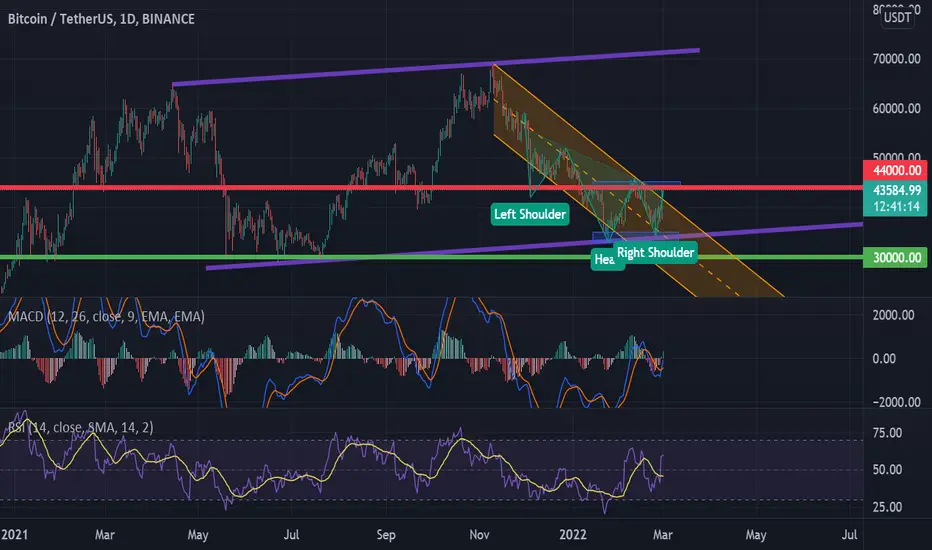
Firstly, BTC has formed an Inverted Head and Shoulders pattern on the chart - this is a very bullish sign. Secondly it has successfully bounced off the long term support (purple line) and broken the downtrend that has been respected since November (orange trend). However, BTC has met some resistance at $44000 and is hovering slightly below there currently. MACD is Bullish on BTC but RSI is approaching the bearish side. Should BTC break the $44000 resistance line then a double bottom pattern would be confirmed signaling another bullish price run. Theses chart patterns are strong indicators of the trend reversal along with the evidence of the broken downtrend. All in all, I believe that the bear market is over and the bulls will take over now for some time until they reach the long term resistance at the very top (purple line at the top). To be completely sure of a trend reversal BTC must break $44000 resistance line yet I have no doubt that it will

Aviso legal
As informações e publicações não se destinam a ser, e não constituem, conselhos ou recomendações financeiras, de investimento, comerciais ou de outro tipo fornecidos ou endossados pela TradingView. Leia mais nos Termos de Uso.
Aviso legal
As informações e publicações não se destinam a ser, e não constituem, conselhos ou recomendações financeiras, de investimento, comerciais ou de outro tipo fornecidos ou endossados pela TradingView. Leia mais nos Termos de Uso.