
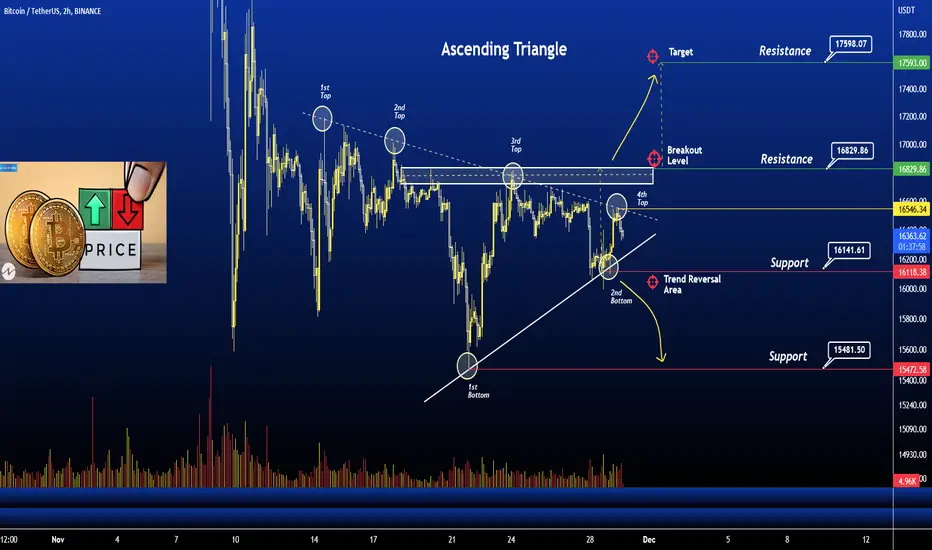
BTC "Ascending Triangle" Breakout
The ascending triangle is a characteristic pattern of an ongoing bullish trend . This triangle is formed by a horizontal upper trend line that connects the highs and the lower trend line that connects the rising lows. If the trend breaks out at the resistance level , the price will continue to move up in this ascending triangle pattern.
Currently, Bitcoin is in the range of $16370. If the pattern continues, the price of HT might reach the resistance levels of $17600 . If the trend reverses, then the price of HT may fall to $15500
Happy Trading

Publicações relacionadas
Aviso legal
As informações e publicações não se destinam a ser, e não constituem, conselhos ou recomendações financeiras, de investimento, comerciais ou de outro tipo fornecidos ou endossados pela TradingView. Leia mais nos Termos de Uso.
Publicações relacionadas
Aviso legal
As informações e publicações não se destinam a ser, e não constituem, conselhos ou recomendações financeiras, de investimento, comerciais ou de outro tipo fornecidos ou endossados pela TradingView. Leia mais nos Termos de Uso.