

Hello, traders!
Follow us to get the latest information quickly.
Have a great day!
-------------------------------------
(BTCUSDT 1D chart)
This volatility period will last until January 11th.
The current price is above the M-Signal indicator on the 1M chart. To confirm this, we need to examine whether the price can rise to the left Fibonacci range of 3 (92026.52) - 3.14 (93570.28).
The StochRSI indicator has entered an oversold zone, and the On-Board Volume indicator is near the High Line.
Since the TC indicator is at 0, any movement is not surprising.
If the On-Board Volume indicator breaks above the High Line and the second EMA, and the price rises to the left Fibonacci range of 3 (92026.52) - 3.14 (93570.28), further upside is expected.
The next volatility period is around January 20th.
Therefore, as the next volatility period passes, we need to examine which of the circles on the chart it is near.
-
If the price falls below the 84739.74-87944.84 range, a step-down trend is likely, so you should consider a response plan.
The maximum decline is between 69K and 73K, but a potential uptrend near 78595.86 is also possible, so you should consider a response plan for this.
-
During an uptrend, you should monitor whether the price can sustain itself by breaking above the M-Signal indicator on the 1W chart.
If the upward breakout is successful, the key will be whether it can break above the 108353-11010569 range.
-
A lot of money has flowed into the coin market, but recently, it has been flowing out.
If this flow of funds changes, the coin market could experience another bull market.
For the coin market to experience a bull market, I believe both BTC and USDT dominance must decline.
USDT dominance must fall below 4.915 and either remain stable or show a downward trend.
BTC dominance must fall below 55.01 and either remain stable or show a downward trend.
If not, I believe it will be difficult for all coins (tokens) to experience a bull market.
2026 is likely to be the year of a major bear market, so it's a good idea to closely monitor capital movements.
USDT and USDC are showing gapping declines as a precursor to a bear market.
-
Thank you for reading to the end.
I wish you successful trading.
--------------------------------------------------
- Here's an explanation of the big picture.
(3-year bull market, 1-year bear market pattern)
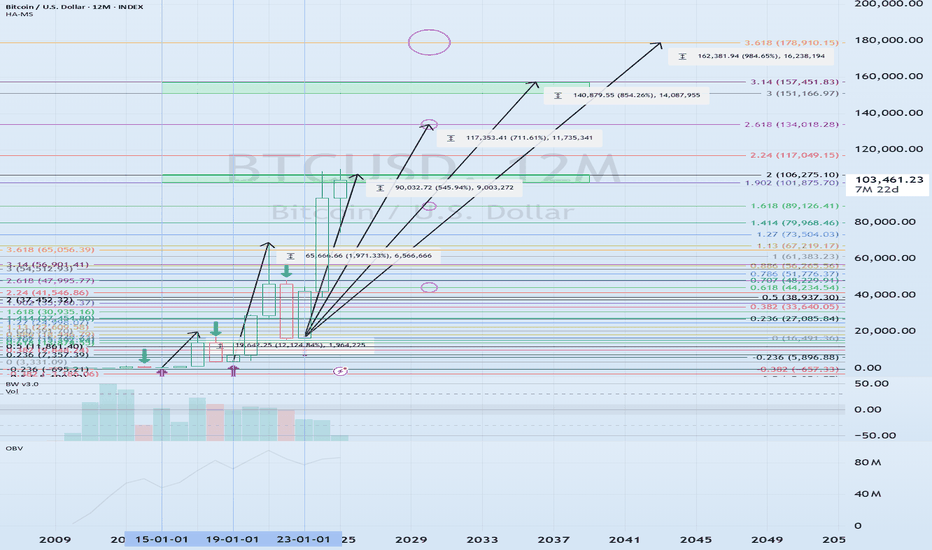
I will provide more detailed information when the bear market begins.
------------------------------------------------------
Trade ativo
#BTCUSDTThe TC indicator appears to have risen above 0 again.
We should examine whether the OBV indicator can rise above the High Line and EMA 2.
We should examine whether the StochRSI indicator can break out of the oversold zone.
Therefore,
The key question is whether the price can find support and rise in the 90404.0 ~ 92383.91 range.
The support range is 84739.74 ~ 87944.84.
Nota
#BTCUSDTThe second challenge is attempting to break above the M-Signal indicator on the 1W chart.
To be considered a bullish move above the M-Signal indicator on the 1W chart, support must be found near the left Fibonacci level of 3.618 (98841.11).
To initiate an uptrend, the price must at least remain above the M-Signal indicator on the 1W chart. However, a full-scale uptrend is expected to begin with a rise above the 108353.0-110105.69 level.
Therefore, the ultimate goal of this uptrend is to see if the price can rise above the 108353.0-110105.59 level.

YouTube: youtube.com/@readcrypto9837
※ Follow X to check out the posts.
※ X를 팔로우하고 게시물을 확인하세요.
◆ t.me/readCryptoChannel
[HA-MS Indicator]
bit.ly/3YxHgvN
[OBV Indicator]
bit.ly/4dcyny3
※ Follow X to check out the posts.
※ X를 팔로우하고 게시물을 확인하세요.
◆ t.me/readCryptoChannel
[HA-MS Indicator]
bit.ly/3YxHgvN
[OBV Indicator]
bit.ly/4dcyny3
Publicações relacionadas
Aviso legal
As informações e publicações não se destinam a ser, e não constituem, conselhos ou recomendações financeiras, de investimento, comerciais ou de outro tipo fornecidos ou endossados pela TradingView. Leia mais nos Termos de Uso.
YouTube: youtube.com/@readcrypto9837
※ Follow X to check out the posts.
※ X를 팔로우하고 게시물을 확인하세요.
◆ t.me/readCryptoChannel
[HA-MS Indicator]
bit.ly/3YxHgvN
[OBV Indicator]
bit.ly/4dcyny3
※ Follow X to check out the posts.
※ X를 팔로우하고 게시물을 확인하세요.
◆ t.me/readCryptoChannel
[HA-MS Indicator]
bit.ly/3YxHgvN
[OBV Indicator]
bit.ly/4dcyny3
Publicações relacionadas
Aviso legal
As informações e publicações não se destinam a ser, e não constituem, conselhos ou recomendações financeiras, de investimento, comerciais ou de outro tipo fornecidos ou endossados pela TradingView. Leia mais nos Termos de Uso.