
Subscribe and get a free trading strategy for Bitcoin and Ethereum every day!
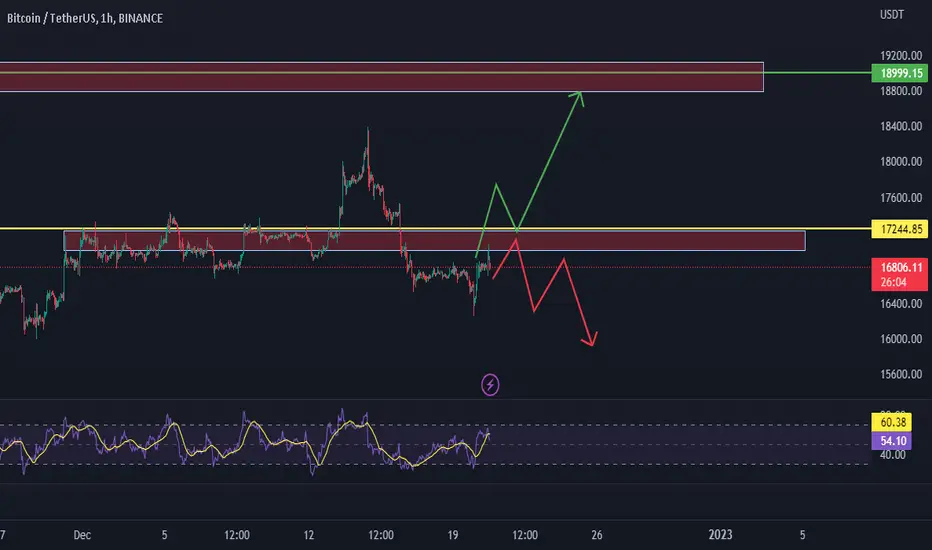
As you can see in the chart BTC is under the resistance zone 17000-17200
Long.
Breaking up and closing above. After some corrections continue to the next zone.
Short.
The price fall down and continue its move after some pullback
P.S
I do not adhere to a time frame in my analysis of the instrument, a reaction in the instrument may occur earlier or later. It is important to understand the price movement when reacting to the level, as well as the buyer and seller reactions. Well, and a few more secrets, this material is not a trading recommendation )))
As you can see in the chart BTC is under the resistance zone 17000-17200
Long.
Breaking up and closing above. After some corrections continue to the next zone.
Short.
The price fall down and continue its move after some pullback
P.S
I do not adhere to a time frame in my analysis of the instrument, a reaction in the instrument may occur earlier or later. It is important to understand the price movement when reacting to the level, as well as the buyer and seller reactions. Well, and a few more secrets, this material is not a trading recommendation )))

Publicações relacionadas
Aviso legal
As informações e publicações não se destinam a ser, e não constituem, conselhos ou recomendações financeiras, de investimento, comerciais ou de outro tipo fornecidos ou endossados pela TradingView. Leia mais nos Termos de Uso.
Publicações relacionadas
Aviso legal
As informações e publicações não se destinam a ser, e não constituem, conselhos ou recomendações financeiras, de investimento, comerciais ou de outro tipo fornecidos ou endossados pela TradingView. Leia mais nos Termos de Uso.