Current Price Action of 
 BTCUSDT :
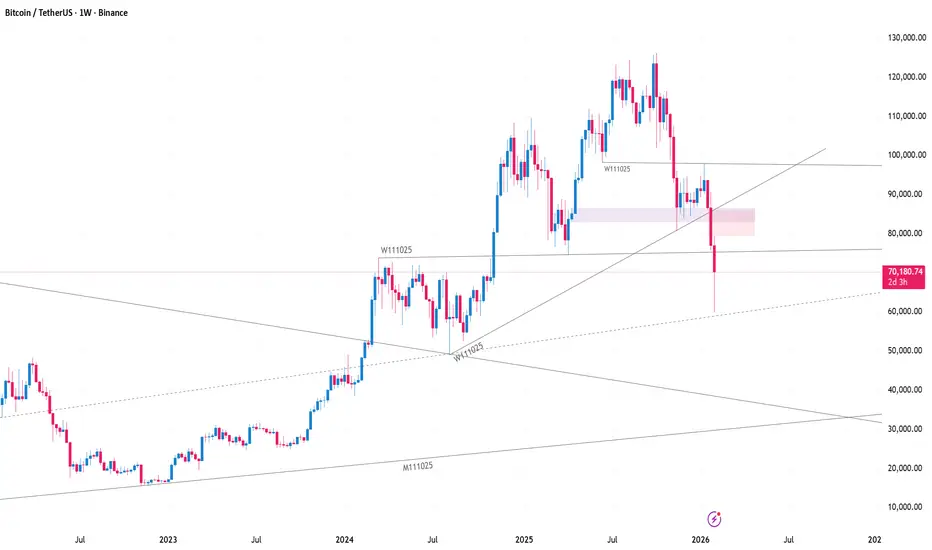
BTCUSDT is trading around $70,000, sharply down from recent highs above $120,000.
The last weekly candle shows a strong bearish momentum, with a long lower wick, indicating that buyers are trying to defend lower levels but are currently overwhelmed.
Support and Resistance:
Immediate Support: ~$60,000, which is the recent weekly low. A break here could trigger a larger correction.
Next Major Support: ~$50,000, which historically acted as a consolidation zone in 2023–2024.
Resistance: ~$80,000–$85,000, which is a previous consolidation and swing area. Any bounce may face sellers here.
Volume Analysis: Weekly volume has spiked on this drop, indicating panic selling or institutional stop-loss clearing.
High selling volume with some lower-wick recovery could suggest liquidity grab — a common setup for potential retracement.
Trend & Market Structure: Weekly trend is currently bearish: lower highs and lower lows forming after the extended uptrend.
If BTC breaks the $60,000 level decisively, it could enter a deeper accumulation phase, potentially retesting $50,000–$45,000.
If BTC holds $60,000 and shows reversal patterns (hammer, bullish engulfing), the next target could be $80,000–$85,000 for a short-term corrective bounce.
Key Observations: The market shows high volatility, meaning careful position sizing is critical.
Weekly trendline or support confirmations will dictate whether the next move is a bounce back up or continuation down.
Traders should watch for weekly candle close signals — a close below $60,000 is bearish, a close above $75,000–$80,000 may signal short-term recovery.
HAVE A NICE WEEKEND
#TRADING BITE
BTCUSDT :BTCUSDT is trading around $70,000, sharply down from recent highs above $120,000.The last weekly candle shows a strong bearish momentum, with a long lower wick, indicating that buyers are trying to defend lower levels but are currently overwhelmed.
Support and Resistance:
Immediate Support: ~$60,000, which is the recent weekly low. A break here could trigger a larger correction.
Next Major Support: ~$50,000, which historically acted as a consolidation zone in 2023–2024.
Resistance: ~$80,000–$85,000, which is a previous consolidation and swing area. Any bounce may face sellers here.
Volume Analysis: Weekly volume has spiked on this drop, indicating panic selling or institutional stop-loss clearing.
High selling volume with some lower-wick recovery could suggest liquidity grab — a common setup for potential retracement.
Trend & Market Structure: Weekly trend is currently bearish: lower highs and lower lows forming after the extended uptrend.
If BTC breaks the $60,000 level decisively, it could enter a deeper accumulation phase, potentially retesting $50,000–$45,000.
If BTC holds $60,000 and shows reversal patterns (hammer, bullish engulfing), the next target could be $80,000–$85,000 for a short-term corrective bounce.
Key Observations: The market shows high volatility, meaning careful position sizing is critical.
Weekly trendline or support confirmations will dictate whether the next move is a bounce back up or continuation down.
Traders should watch for weekly candle close signals — a close below $60,000 is bearish, a close above $75,000–$80,000 may signal short-term recovery.
HAVE A NICE WEEKEND
#TRADING BITE

Aviso legal
As informações e publicações não se destinam a ser, e não constituem, conselhos ou recomendações financeiras, de investimento, comerciais ou de outro tipo fornecidos ou endossados pela TradingView. Leia mais nos Termos de Uso.
Aviso legal
As informações e publicações não se destinam a ser, e não constituem, conselhos ou recomendações financeiras, de investimento, comerciais ou de outro tipo fornecidos ou endossados pela TradingView. Leia mais nos Termos de Uso.