
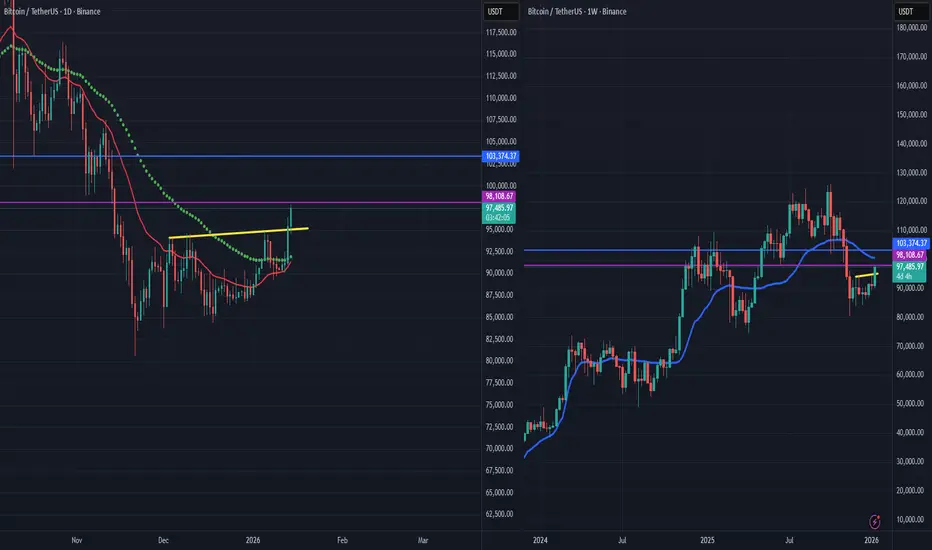
The chart shows an inverse head and shoulders pattern, but as long as we stay above the yellow line, the direction is upward. The first target of the formation is the 98,108 level, which corresponds to the 1.414 Fibonacci retracement of the breakout, with the main target being around 103,000. Pay attention to the Kaufman indicator on the weekly timeframe as an intermediate resistance level.

Aviso legal
As informações e publicações não se destinam a ser, e não constituem, conselhos ou recomendações financeiras, de investimento, comerciais ou de outro tipo fornecidos ou endossados pela TradingView. Leia mais nos Termos de Uso.
Aviso legal
As informações e publicações não se destinam a ser, e não constituem, conselhos ou recomendações financeiras, de investimento, comerciais ou de outro tipo fornecidos ou endossados pela TradingView. Leia mais nos Termos de Uso.