
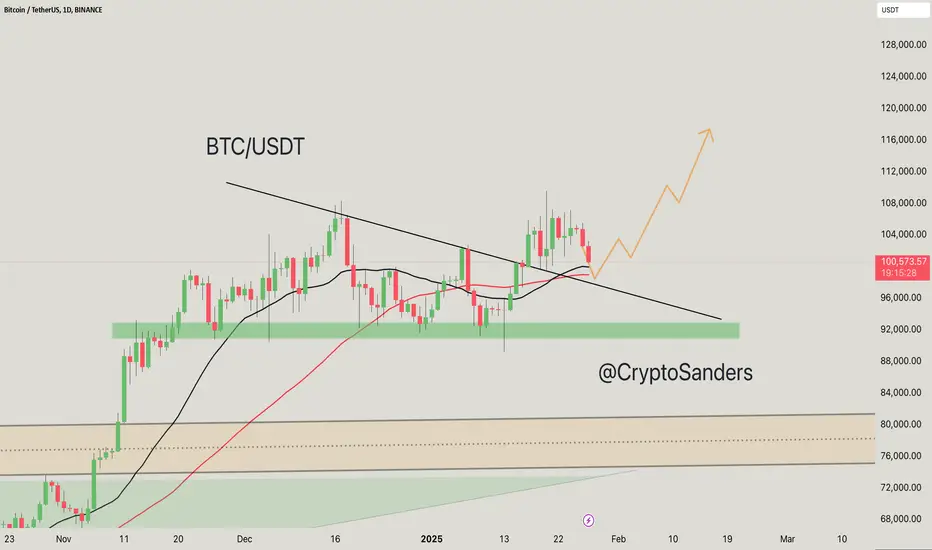
BTC is retesting the breakout point near the descending trendline (around $98,000-$100,000).
If buyers step in, this retest could act as a launchpad for a potential bounce.
The green zone ($92,000-$96,000) remains a crucial area of demand, offering strong support in case of a deeper retracement.
The 50-day SMA (red line) is moving upwards, currently around $98,000. It acts as a dynamic support level.
BTC is slightly above the 21-day SMA (black line), which suggests short-term support.
Despite the pullback, the overall structure suggests a bullish continuation.
The orange projection shows a potential consolidation followed by a move towards higher targets near $112,000-$116,000.
If you found this analysis helpful, hit the Like button and share your thoughts or questions in the comments below. Your feedback matters!
Thanks for your support!
DYOR. NFA

Publicações relacionadas
Aviso legal
As informações e publicações não se destinam a ser, e não constituem, conselhos ou recomendações financeiras, de investimento, comerciais ou de outro tipo fornecidos ou endossados pela TradingView. Leia mais nos Termos de Uso.
Publicações relacionadas
Aviso legal
As informações e publicações não se destinam a ser, e não constituem, conselhos ou recomendações financeiras, de investimento, comerciais ou de outro tipo fornecidos ou endossados pela TradingView. Leia mais nos Termos de Uso.