
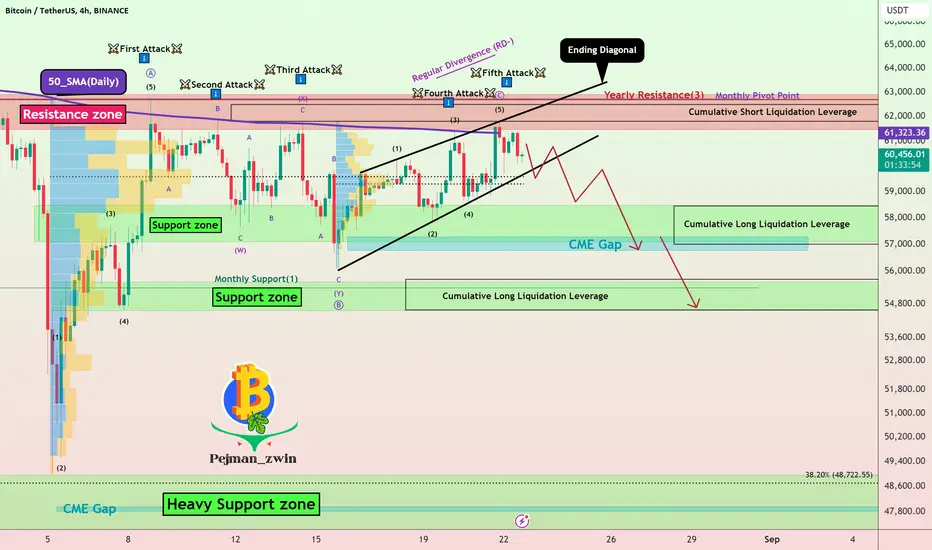
Bitcoin failed to break the Resistance zone ($58,500-$57,000) for the fifth time. It seems that important news is needed to break the resistance zone.
According to the Elliott wave theory, Bitcoin seems to have succeeded in completing the main wave C with the Ending Diagonal Pattern.
Also, we can see Regular Divergence(RD-) between Consecutive Peaks.
Looking at the USDT.D% chart, we find that USDT.D% is in a symmetrical triangle. The main wave 4 can be completed in this triangle. I expect USDT.D% to pump after breaking the upper line of the symmetrical triangle, which will cause a correction in the Cryptocurrency market.👇

Another important chart that can help us analyze Bitcoin is the BTC.D% chart. BTC.D% is moving near the Heavy Resistance zone(60%-57.2%) and the Resistance line, and according to the theory of Elliott waves, it seems that it has completed the main wave 5 in the two-day time frame with the help of Ending Diagonal. So, we should expect a correction of BTC.D%, which means that if the cryptocurrency marketcap decreases, Bitcoin can fall more.👇

I expect Bitcoin to at least fill the CME Gap($55,880-$56,775) after breaking the lower line of the Ending Diagonal.
Note: If Bitcoin goes over $63,000, we should wait for Bitcoin to pump to $65,000 (at least).
Bitcoin Analyze (BTCUSDT), 4-hour time frame⏰.
Do not forget to put Stop loss for your positions (For every position you want to open).
Please follow your strategy; this is just my Idea, and I will gladly see your ideas in this post.
Please do not forget the ✅' like'✅ button 🙏😊 & Share it with your friends; thanks, and Trade safe.
According to the Elliott wave theory, Bitcoin seems to have succeeded in completing the main wave C with the Ending Diagonal Pattern.
Also, we can see Regular Divergence(RD-) between Consecutive Peaks.
Looking at the USDT.D% chart, we find that USDT.D% is in a symmetrical triangle. The main wave 4 can be completed in this triangle. I expect USDT.D% to pump after breaking the upper line of the symmetrical triangle, which will cause a correction in the Cryptocurrency market.👇
Another important chart that can help us analyze Bitcoin is the BTC.D% chart. BTC.D% is moving near the Heavy Resistance zone(60%-57.2%) and the Resistance line, and according to the theory of Elliott waves, it seems that it has completed the main wave 5 in the two-day time frame with the help of Ending Diagonal. So, we should expect a correction of BTC.D%, which means that if the cryptocurrency marketcap decreases, Bitcoin can fall more.👇
I expect Bitcoin to at least fill the CME Gap($55,880-$56,775) after breaking the lower line of the Ending Diagonal.
Note: If Bitcoin goes over $63,000, we should wait for Bitcoin to pump to $65,000 (at least).
Bitcoin Analyze (BTCUSDT), 4-hour time frame⏰.
Do not forget to put Stop loss for your positions (For every position you want to open).
Please follow your strategy; this is just my Idea, and I will gladly see your ideas in this post.
Please do not forget the ✅' like'✅ button 🙏😊 & Share it with your friends; thanks, and Trade safe.
Nota
Powell's words and the possibility of an interest rate cut pumped up the financial markets in the final hours (gold and Bitcoin).However, the analysis is still valid, and if the Resistance zone ($58,500-$57,000) is broken, we should expect Bitcoin to pump up to $65,000.
Trade ativo
In my opinion, Bitcoin has not succeeded in breaking the Resistance zone ($58,500-$57,000) in the sixth attack, and the sign of this can be the formation of a shooting star candlestick pattern.
Nota
5-minute time frame.
In terms of classical technical analysis, two patterns, the Rising Wedge Pattern and the Ascending Broadening Wedge Pattern, can cause Bitcoin to fall.
Note: In these hours, the correlation between Bitcoin and gold is higher than before.
Trade fechado: stop atingido
⛔️Stop loss was touched⛔️Trade ativo
Long positionTrade fechado: objetivo atingido
As I said in the text of the post, we have to wait for $65,000 if the resistance zone is broken
🎁 Free Real VIP Forex and Crypto Signals. Please visit:
🔗 t.me/ProTrader_365
🔗 t.me/ProTrader_365
Publicações relacionadas
Aviso legal
As informações e publicações não se destinam a ser, e não constituem, conselhos ou recomendações financeiras, de investimento, comerciais ou de outro tipo fornecidos ou endossados pela TradingView. Leia mais nos Termos de Uso.
🎁 Free Real VIP Forex and Crypto Signals. Please visit:
🔗 t.me/ProTrader_365
🔗 t.me/ProTrader_365
Publicações relacionadas
Aviso legal
As informações e publicações não se destinam a ser, e não constituem, conselhos ou recomendações financeiras, de investimento, comerciais ou de outro tipo fornecidos ou endossados pela TradingView. Leia mais nos Termos de Uso.