
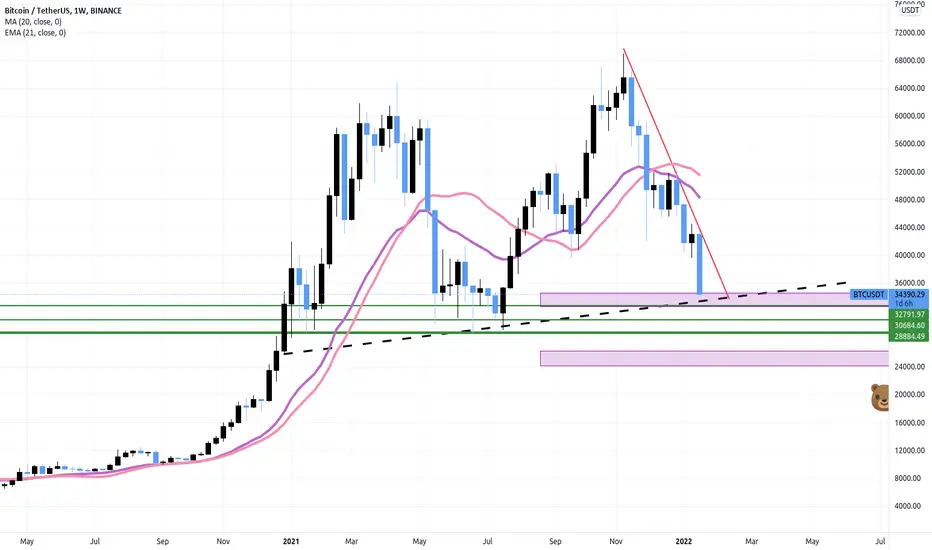
In this idea I've used the following:
1) Agled Dotted Trendline that coincides with a FIB level of 0.618 to indicate Support
2) Angled Trendline in Red to indicate resistance
3) Horizontal Support Lines to indicate the next major supports
4) CME FUTURE Gaps, to indicate regions where BTC might potentially move.
1) Agled Dotted Trendline that coincides with a FIB level of 0.618 to indicate Support
2) Angled Trendline in Red to indicate resistance
3) Horizontal Support Lines to indicate the next major supports
4) CME FUTURE Gaps, to indicate regions where BTC might potentially move.

Aviso legal
As informações e publicações não se destinam a ser, e não constituem, conselhos ou recomendações financeiras, de investimento, comerciais ou de outro tipo fornecidos ou endossados pela TradingView. Leia mais nos Termos de Uso.
Aviso legal
As informações e publicações não se destinam a ser, e não constituem, conselhos ou recomendações financeiras, de investimento, comerciais ou de outro tipo fornecidos ou endossados pela TradingView. Leia mais nos Termos de Uso.