
Is ok to doubt? Are we justified in doubting?
Where is Bitcoin headed next? Are there any clues on this chart?
How to define a bearish or bullish chart setup? How to define a chart's potential?
How do I know if the potential of this chart is either bullish or bearish?
How are you feeling in this wonderful day?
Good afternoon my fellow Cryptocurrency trader, it is such a pleasure for me to write again for you today. Today is a nice day, a New Moon day, and you know what they say; New Moon is a time when your thoughts, wishes and desires can go the furthest on the astral plane, so, my wish is for Bitcoin to go up.
We can gauge the potential of a chart based on the trend, the big picture, recent price action as well as resistance and support.
If the trend is bearish, the action happening at support and this support gets challenged over and over, we can say that bearish potential is active and a lower low becomes possible.
If the trend is neutral, the market moved down but also up; support gets challenged only once but it holds; the action happening at support while prices are slowly rising, we can say bullish potential is active.
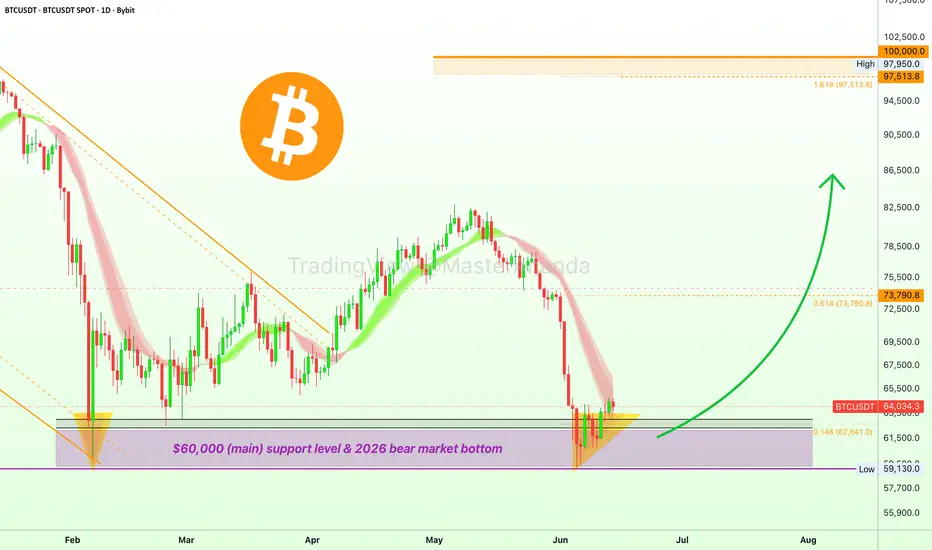
The previous low happened exactly at $60,000, long-term support though is present at $57,772, a price level that was never challenged.
The most recent drop reached a price of $59,130 on a wick, once more, the long-term support at $57,772 remains unchallenged. More than that, the market recovered the next day and the lowest close happened at $60,884 rather than below 60K. Bitcoin currently trades at $64,000 and has been rising daily, steadily and slowly, a signal of strength.
The chart setup is a repeat of 6-Feb. Back then, as soon as Bitcoin hit $60,000 buyers showed up, the massive short-covering resulted in an instant price jump. There isn't a short-covering reaction this time but neither a bearish continuation. The whales will start buying again and this will propel a new bullish wave.
Think of this, inflation numbers were the worst and yet, Bitcoin was unaffected... This shows you everything you need to know.
» $40,000 or $100,000?
Bitcoin is going up.
Namaste.
Where is Bitcoin headed next? Are there any clues on this chart?
How to define a bearish or bullish chart setup? How to define a chart's potential?
How do I know if the potential of this chart is either bullish or bearish?
How are you feeling in this wonderful day?
Good afternoon my fellow Cryptocurrency trader, it is such a pleasure for me to write again for you today. Today is a nice day, a New Moon day, and you know what they say; New Moon is a time when your thoughts, wishes and desires can go the furthest on the astral plane, so, my wish is for Bitcoin to go up.
We can gauge the potential of a chart based on the trend, the big picture, recent price action as well as resistance and support.
If the trend is bearish, the action happening at support and this support gets challenged over and over, we can say that bearish potential is active and a lower low becomes possible.
If the trend is neutral, the market moved down but also up; support gets challenged only once but it holds; the action happening at support while prices are slowly rising, we can say bullish potential is active.
The previous low happened exactly at $60,000, long-term support though is present at $57,772, a price level that was never challenged.
The most recent drop reached a price of $59,130 on a wick, once more, the long-term support at $57,772 remains unchallenged. More than that, the market recovered the next day and the lowest close happened at $60,884 rather than below 60K. Bitcoin currently trades at $64,000 and has been rising daily, steadily and slowly, a signal of strength.
The chart setup is a repeat of 6-Feb. Back then, as soon as Bitcoin hit $60,000 buyers showed up, the massive short-covering resulted in an instant price jump. There isn't a short-covering reaction this time but neither a bearish continuation. The whales will start buying again and this will propel a new bullish wave.
Think of this, inflation numbers were the worst and yet, Bitcoin was unaffected... This shows you everything you need to know.
» $40,000 or $100,000?
Bitcoin is going up.
Namaste.
Trade ativo
To say that Bitcoin is bullish right now would be the understatement of the year... Now, I've been receiving some feedback and many questions and they all revolve around how far Bitcoin can go. Naturally, they are all coming from bears.
I don't want to put anybody down but I have to state the facts.
My bearish friends are saying that Bitcoin is going to come crashing down basically right away, that is, after hitting $70,000. This is a very disturbing suggestion because it is not supported by the chart, technicals, altcoins market, indicators, and so. Also, these are the same people that said Bitcoin would crash to $40,000 after peaking at $80,000, but we see how the $60,000 support holds.
My main signal, which I've been mentioning quite often, right now comes from the daily RSI, it is an unbreakable signal and it has never failed before. When Bitcoin reaches extreme oversold conditions on the daily RSI, it simply reverses and grow. There is never a continuation one or two weeks afterwards. In all of Bitcoin's history, after this signal shows up there is growth for at least 1-2 months. Normally 2-3 months.
BTCUSDT daily RSI:
November 2025: Bitcoin becomes oversold on the RSI and resolves to grow for 60 days.
February 2026: Bitcoin becomes oversold on the RSI and resolves to grow for 90 days.
June 2026: Bitcoin becomes oversold on the RSI and can now grow anywhere between 60 to 120 days. This is because the reading went much lower... This signal alone breaks all the bearish predictions saying Bitcoin will crash in a matter of days. Bitcoin is going up for months.
The MACD is the same of course. You get a bullish cross and this is followed by months of bullish action. There is also a hidden bullish divergence on this one:
The STOCH is the same, it supports a bullish wave that can last months (but this one isn't necessary as the other signals are just too strong).
Then we also have the altcoins market, the date and many other factors. I am not going to go through all of the signals again because I already did so recently (you can visit my profile), but check the long-term chart for ETH.
Crypto is going up and it will be wild, big and fun.
Thank you for reading.
Namaste.
Nota
Here is the long-term ETHUSD chart that I just mentioned: 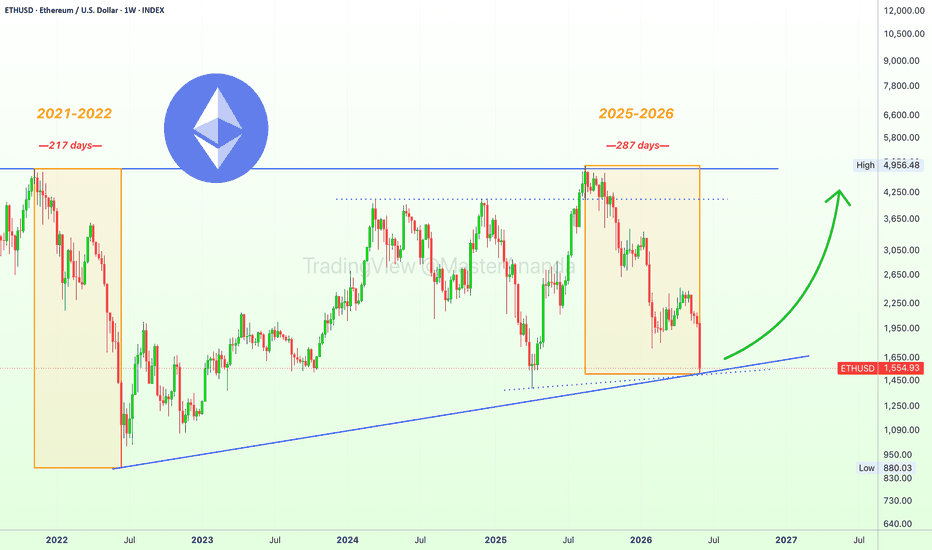
I will do one for Bitcoin and it goes like this: We can divide the month in two halves, the first and second. The first half started red and produced a long lower wick; the second half is starting to recover as Bitcoin turns green.
Another example: Last month Bitcoin peaked and went sideways at resistance until it started to crash. The first half of May was green, the second half red. The first half of June red, the second half green.
EMA55 has been confirmed as support on the monthly timeframe for Bitcoin, this can result in months of bullish action. I will comeback and give you more. Boost this post to let me know...
Nota
Bitcoin's monthly chart with EMA55 working as support: Trade fechado: objetivo atingido
Cryptocurrency market open-interest: Looks just like Bitcoin. There was a drop but we have a higher low. It is now going up again and with the higher low, you know it is bullish. So far we can say that the recent correction produced a full reset. A reset implies the start of a new market phase.
Long/Short Ratio Accounts:
The lowest point, where people were the most bearish, happened in early May, right when Bitcoin peaked. This is true also of October 2025. Most people were bearish right before the crash. Something changed.
Bitcoin went through its correction (support confirmed) and notice this chart; people are no longer bearish. So, the traders on Binance were positioned correctly before the start of the bear market last year and also now before the crash. They switched, they are now mostly bullish. So, shouldn't we trust these people that have been getting it right all along?
The market is betting that Bitcoin is going up.
Long Short Accounts %:
58.79% of the accounts are bullish (LONG) while 41.21% are bearish (SHORT).
This indicator had the lowest reading in early May, before the start of the correction. This one clearly shows changing market conditions.
For prices to drop people have to sell, but this isn't the case. We have signals coming from the candles, the chart structure, the indicators and now also from the futures market, fundamentals, it all points to Bitcoin moving higher.
If you enjoyed this post, give a boost and make sure to follow.
Thank you for reading.
Namaste.
Nota
Watch Uniswap breaking bullish more than 30% within 24 hours...
Watch Worldcoin hitting a higher high (bullish continuation)...

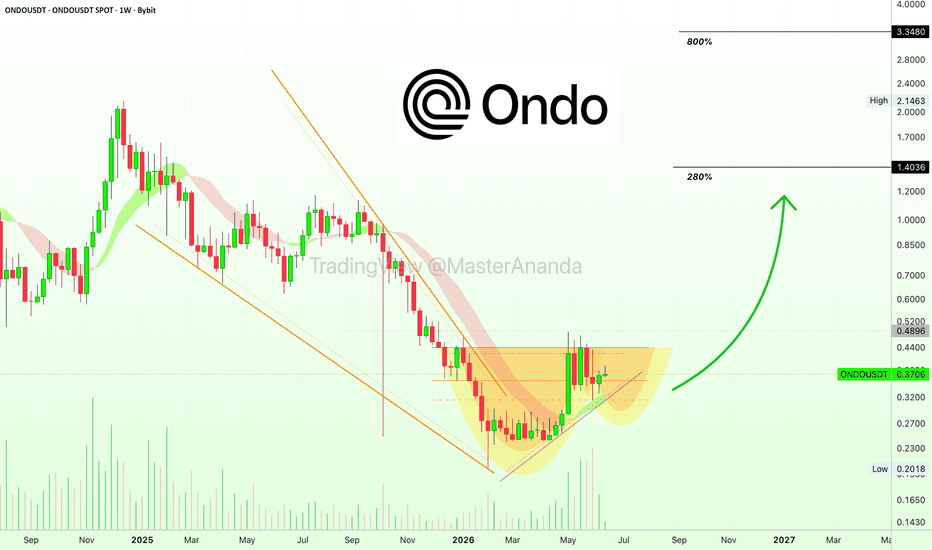
Watch Ondo Finance recovering with a cup & handle pattern...
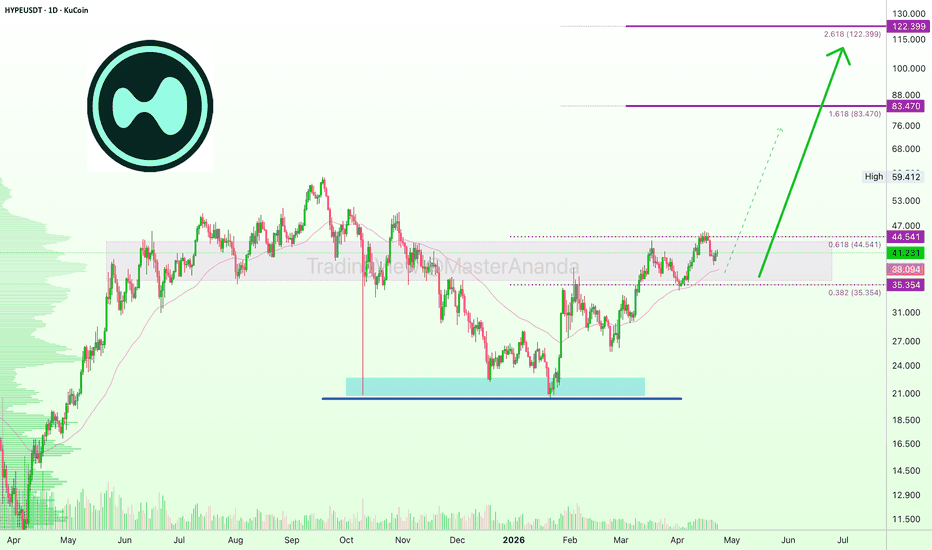
Watch Hyperliquid hit a new all-time high...
Watch how NEAR Protocol is maintaining all the ground gained...

Watch how RIF has been growing since December 2025...
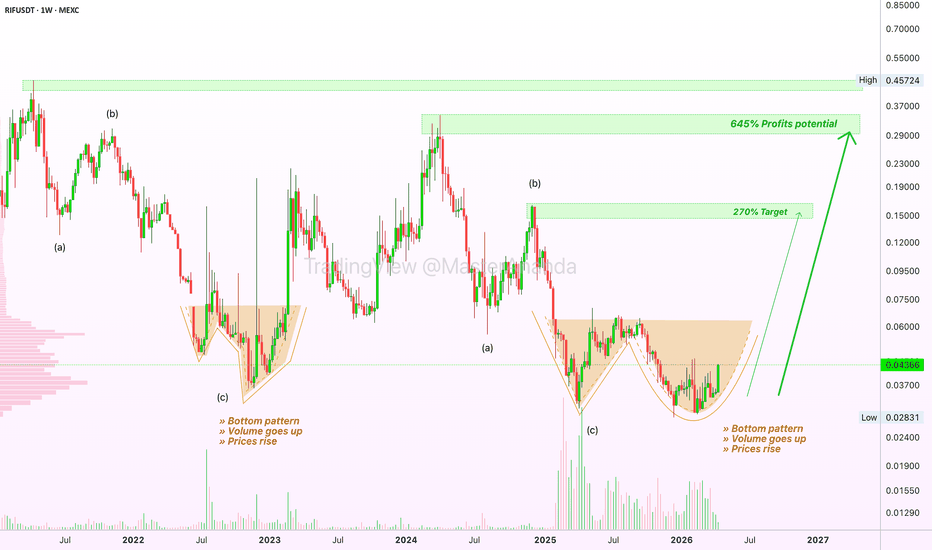
BULLISH ALTCOINS MEANS BULLISH BITCOIN.
Namaste.
Nota
Thank you all for the support. Let's continue sharing. We are a family here... We are friends.Like or dislike, from all interactions we can grow and learn.
Send me hate or love, either way, I appreciate your continued support.
Namaste.

Trading Cryptocurrencies can be the hardest undertaking ever without the right trade-numbers, without accurate private-access information. Free is free, but the best always requires sweat, an investment. Since 2017 👇
t.me/masteranandatrades/8778
t.me/masteranandatrades/8778
Publicações relacionadas
Aviso legal
As informações e publicações não se destinam a ser, e não constituem, conselhos ou recomendações financeiras, de investimento, comerciais ou de outro tipo fornecidos ou endossados pela TradingView. Leia mais nos Termos de Uso.
Trading Cryptocurrencies can be the hardest undertaking ever without the right trade-numbers, without accurate private-access information. Free is free, but the best always requires sweat, an investment. Since 2017 👇
t.me/masteranandatrades/8778
t.me/masteranandatrades/8778
Publicações relacionadas
Aviso legal
As informações e publicações não se destinam a ser, e não constituem, conselhos ou recomendações financeiras, de investimento, comerciais ou de outro tipo fornecidos ou endossados pela TradingView. Leia mais nos Termos de Uso.