
Hello everyone, here is my breakdown of the current BTCUSDT setup.
Market Analysis
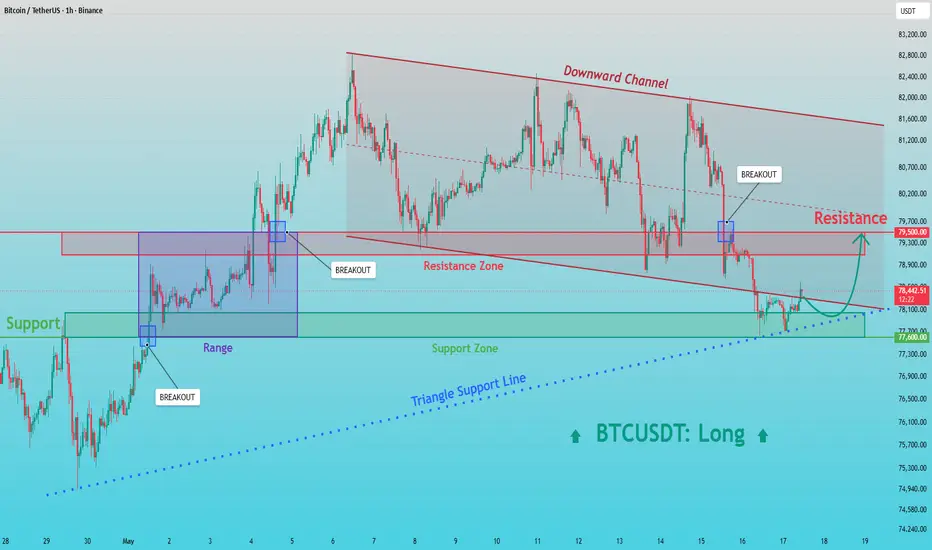
Bitcoin previously traded inside a descending channel, confirming short-term bearish pressure. After several failed attempts to break above the resistance zone, price declined toward the lower boundary of the structure and formed a rising triangle support line near the 77,600 buyer zone.
Currently, BTCUSDT is trading above the 77,600 support zone while remaining below the 79,500 resistance level. Price recently rebounded from the triangle support structure and is attempting to recover after a strong bearish impulse, signaling that buyers are becoming active near the lower boundary of the pattern.
My Scenario & Strategy
As long as BTCUSDT remains above the 77,600 support zone and continues to respect the ascending triangle support line, the bullish recovery scenario remains valid. A continuation higher could push price toward the 79,500 resistance zone (TP1).
However, if price breaks below the 77,600 support level and loses the triangle support structure, the bullish outlook would be invalidated, opening the path for a deeper bearish continuation.
That’s the setup I’m tracking. Thank you for your attention, and always manage your risk.
Market Analysis
Bitcoin previously traded inside a descending channel, confirming short-term bearish pressure. After several failed attempts to break above the resistance zone, price declined toward the lower boundary of the structure and formed a rising triangle support line near the 77,600 buyer zone.
Currently, BTCUSDT is trading above the 77,600 support zone while remaining below the 79,500 resistance level. Price recently rebounded from the triangle support structure and is attempting to recover after a strong bearish impulse, signaling that buyers are becoming active near the lower boundary of the pattern.
My Scenario & Strategy
As long as BTCUSDT remains above the 77,600 support zone and continues to respect the ascending triangle support line, the bullish recovery scenario remains valid. A continuation higher could push price toward the 79,500 resistance zone (TP1).
However, if price breaks below the 77,600 support level and loses the triangle support structure, the bullish outlook would be invalidated, opening the path for a deeper bearish continuation.
That’s the setup I’m tracking. Thank you for your attention, and always manage your risk.
Trade fechado manualmente
Unfortunately, we see that the price of Bitcoin has broken the ascending support line, which may indicate weakness of buyers at this stage. Therefore, our forecast is canceled!
🚀If you want became part of my trading team & start making big profits welcome to my paid VIP signals group, write me✏️ t.me/ratner_1
❤️Welcome to my telegram channel👉🏼 t.me/ratner_trading
❤️Welcome to my telegram channel👉🏼 t.me/ratner_trading
Aviso legal
As informações e publicações não se destinam a ser, e não constituem, conselhos ou recomendações financeiras, de investimento, comerciais ou de outro tipo fornecidos ou endossados pela TradingView. Leia mais nos Termos de Uso.
🚀If you want became part of my trading team & start making big profits welcome to my paid VIP signals group, write me✏️ t.me/ratner_1
❤️Welcome to my telegram channel👉🏼 t.me/ratner_trading
❤️Welcome to my telegram channel👉🏼 t.me/ratner_trading
Aviso legal
As informações e publicações não se destinam a ser, e não constituem, conselhos ou recomendações financeiras, de investimento, comerciais ou de outro tipo fornecidos ou endossados pela TradingView. Leia mais nos Termos de Uso.