
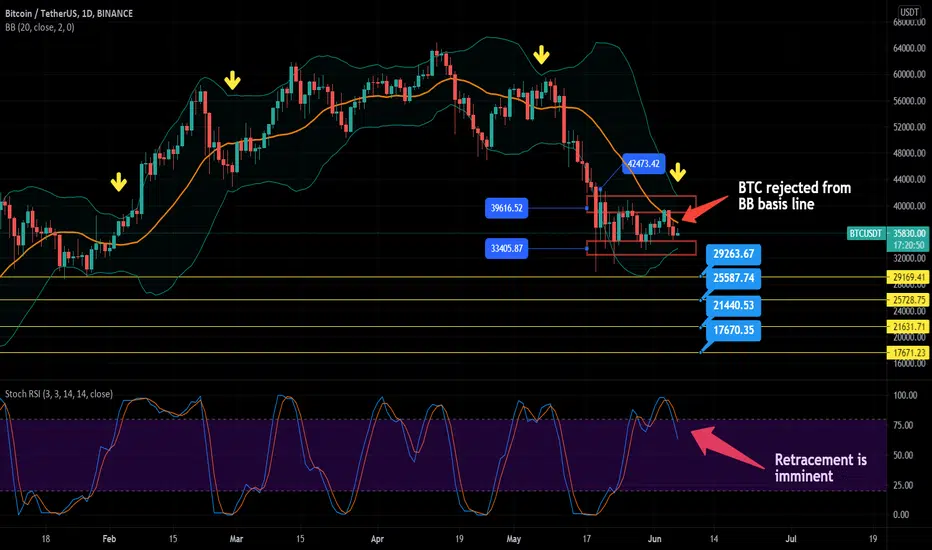
Based on BTC daily chart, it is still consolidating between $33k to $39k range. Usually, the longer the consolidation, the bigger the next move will be.
Based on Bollinger Band indicator, the squeeze of it is so tight where it validates my first statement. The next downtrend move may find support in one of the 4 strong support accordingly. If first support lose, it will go to the next support.
Furthermore, Stochastic RSI is already in the downtrend movement which indicates that a retracement is imminent unless BTC is able to break the Bollinger Band basis line and stay above it. Until then retracement will happen around the corner.
Based on Bollinger Band indicator, the squeeze of it is so tight where it validates my first statement. The next downtrend move may find support in one of the 4 strong support accordingly. If first support lose, it will go to the next support.
Furthermore, Stochastic RSI is already in the downtrend movement which indicates that a retracement is imminent unless BTC is able to break the Bollinger Band basis line and stay above it. Until then retracement will happen around the corner.

Publicações relacionadas
Aviso legal
As informações e publicações não se destinam a ser, e não constituem, conselhos ou recomendações financeiras, de investimento, comerciais ou de outro tipo fornecidos ou endossados pela TradingView. Leia mais nos Termos de Uso.
Publicações relacionadas
Aviso legal
As informações e publicações não se destinam a ser, e não constituem, conselhos ou recomendações financeiras, de investimento, comerciais ou de outro tipo fornecidos ou endossados pela TradingView. Leia mais nos Termos de Uso.