
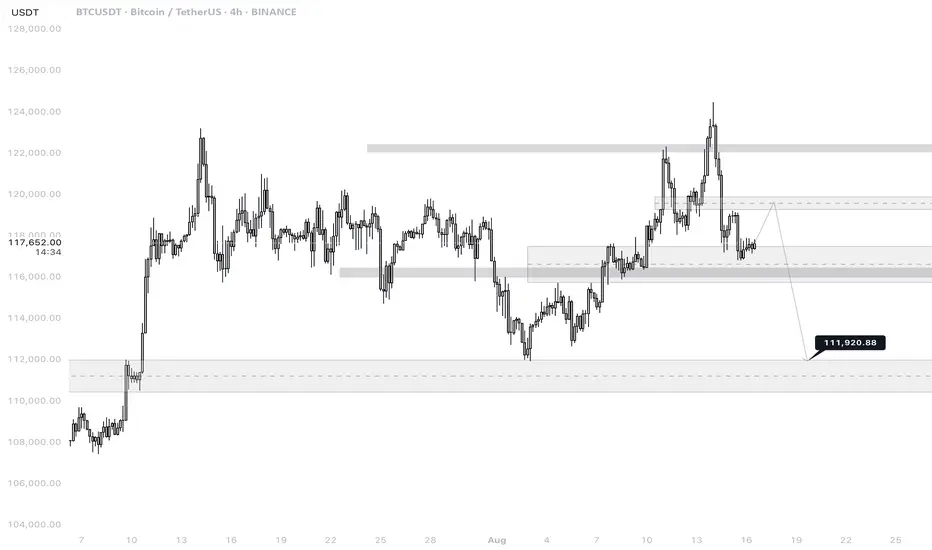
🔎 Chart Context
• Pair: BTC/USDT
• Exchange: Binance
• Timeframe: 4H (240M)
• Date: 16 August 2025
The chart applies price action, liquidity sweep, demand/supply zones, and FVG (Fair Value Gaps) to forecast market behavior.
📊 Key Observations
1. Major Highs & Lows
• Recent Highs: 124,474 and 123,218
• Key Resistance: 122,335.16 zone
• Significant Lows: 112,650.00 and 111,920.00 (highlighted as potential liquidity target)
These represent liquidity pools where institutional activity often occurs.
2. Current Price
• Trading around 117,621 – 118,235 zone at the time of charting.
• Price is consolidating after rejection from 124,474 top.
3. Liquidity Structure
• Market swept liquidity above 124,474 and quickly rejected, signaling a potential distribution phase.
• Below, untested liquidity exists near 111,920, which is marked as a probable downside target.
4. FVG & Demand Zones
• A Fair Value Gap (FVG) remains open around 115,200–116,500, which price could retest before further downside.
• Stronger demand lies around 111,920–112,650, likely to act as a magnet if the retracement deepens.
5. Resistance Zones
• 122,335–124,474 is a strong supply block / distribution zone, which caused the sharp rejection.
• Any bullish recovery will need to reclaim 120,247 and 119,800 to sustain upside momentum.
📈 Bullish Case (Less Likely, Countertrend Scenario)
• If BTC holds above 115,200–116,500 FVG zone and forms higher lows:
• First target: 119,800 (minor supply).
• Second target: 122,335 (major resistance).
• Reclaiming this zone could trigger a retest of 124,474.
• However, this requires strong demand and volume, which currently looks weak.
📉 Bearish Case (Higher Probability Scenario)
• After liquidity grab at 124,474, rejection suggests continuation lower.
• Likely retracement path:
• Retest 116,500–115,200 (FVG zone)
• Break below to sweep 112,650
• Final downside liquidity target: 111,920
This scenario aligns with the chart projection arrow pointing toward 111,920.88.
⚡ Trading Plan
• Short Entries (Preferred Play):
• At 119,800–120,247 (supply retest)
• At 122,335 zone (distribution block)
• Target 1: 116,500–115,200 (partial close).
• Target 2: 112,650.
• Target 3: 111,920 (main liquidity sweep).
• Stop-loss: Above 124,474 high.
• Long Setup (Countertrend, Risky):
• Entry at 115,200–116,500 (FVG)
• TP1: 119,800
• TP2: 122,335
• Stop: Below 114,700
• Pair: BTC/USDT
• Exchange: Binance
• Timeframe: 4H (240M)
• Date: 16 August 2025
The chart applies price action, liquidity sweep, demand/supply zones, and FVG (Fair Value Gaps) to forecast market behavior.
📊 Key Observations
1. Major Highs & Lows
• Recent Highs: 124,474 and 123,218
• Key Resistance: 122,335.16 zone
• Significant Lows: 112,650.00 and 111,920.00 (highlighted as potential liquidity target)
These represent liquidity pools where institutional activity often occurs.
2. Current Price
• Trading around 117,621 – 118,235 zone at the time of charting.
• Price is consolidating after rejection from 124,474 top.
3. Liquidity Structure
• Market swept liquidity above 124,474 and quickly rejected, signaling a potential distribution phase.
• Below, untested liquidity exists near 111,920, which is marked as a probable downside target.
4. FVG & Demand Zones
• A Fair Value Gap (FVG) remains open around 115,200–116,500, which price could retest before further downside.
• Stronger demand lies around 111,920–112,650, likely to act as a magnet if the retracement deepens.
5. Resistance Zones
• 122,335–124,474 is a strong supply block / distribution zone, which caused the sharp rejection.
• Any bullish recovery will need to reclaim 120,247 and 119,800 to sustain upside momentum.
📈 Bullish Case (Less Likely, Countertrend Scenario)
• If BTC holds above 115,200–116,500 FVG zone and forms higher lows:
• First target: 119,800 (minor supply).
• Second target: 122,335 (major resistance).
• Reclaiming this zone could trigger a retest of 124,474.
• However, this requires strong demand and volume, which currently looks weak.
📉 Bearish Case (Higher Probability Scenario)
• After liquidity grab at 124,474, rejection suggests continuation lower.
• Likely retracement path:
• Retest 116,500–115,200 (FVG zone)
• Break below to sweep 112,650
• Final downside liquidity target: 111,920
This scenario aligns with the chart projection arrow pointing toward 111,920.88.
⚡ Trading Plan
• Short Entries (Preferred Play):
• At 119,800–120,247 (supply retest)
• At 122,335 zone (distribution block)
• Target 1: 116,500–115,200 (partial close).
• Target 2: 112,650.
• Target 3: 111,920 (main liquidity sweep).
• Stop-loss: Above 124,474 high.
• Long Setup (Countertrend, Risky):
• Entry at 115,200–116,500 (FVG)
• TP1: 119,800
• TP2: 122,335
• Stop: Below 114,700

Publicações relacionadas
Aviso legal
As informações e publicações não se destinam a ser, e não constituem, conselhos ou recomendações financeiras, de investimento, comerciais ou de outro tipo fornecidos ou endossados pela TradingView. Leia mais nos Termos de Uso.
Publicações relacionadas
Aviso legal
As informações e publicações não se destinam a ser, e não constituem, conselhos ou recomendações financeiras, de investimento, comerciais ou de outro tipo fornecidos ou endossados pela TradingView. Leia mais nos Termos de Uso.