
Hello, fellow traders!
Follow us to get the latest information quickly.
Have a great day.
-------------------------------------
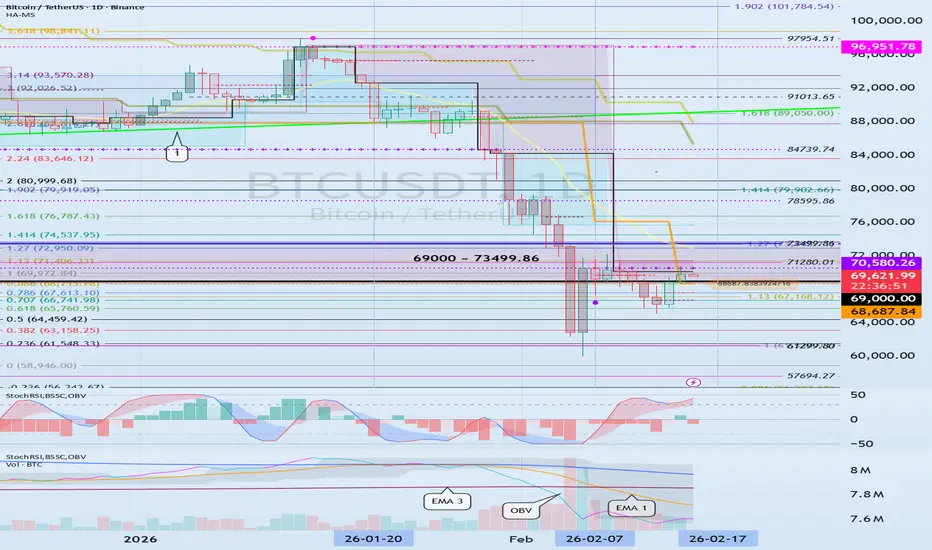
The key points to watch are the HA-Low indicator and the DOM (-60) indicator.
If the HA-Low and DOM (-60) indicators provide support, then that's a good time to buy.
Accordingly, the key question is whether the price can rise after finding support in the 68687.84 ~ 70580.26 range.
-
The StochRSI 20, 50, and 80 indicators are displayed on the chart because they provide useful information for detailed trading.
The StochRSI indicator can also be viewed as an indicator that reverts to its mean based on the 50 level.
Therefore, we need to carefully monitor the trend when the StochRSI crosses the 50 level.
While the StochRSI indicator is typically interpreted based on when it enters or exits overbought or oversold levels, this provides useful information when interpreting auxiliary indicators.
Currently, the order is StochRSI 20 > StochRSI 80 > StochRSI 50.
In other words, to break out of the low zone (oversold zone), the StochRSI must rise above the 20 level. Therefore, ultimately, we can see that the StochRSI must rise above the 20 level (75719.90).
However, the StochRSI 80 level is formed at 71453.53, indicating that a short-term peak has been formed.
This suggests that the current trend is likely a rebound from a downtrend.
Even if the StochRSI rises above the 80 level, if it fails to rise above the 20 level, it is highly likely that the price will eventually decline.
However, if the price remains above the StochRSI 50 level, the upward movement may trigger a change in the positions of the StochRSI 20 and StochRSI 80 indicators, potentially signaling a continued uptrend. Therefore, it's important to monitor whether the price can remain above the StochRSI 50 level (70130.00).
-
To break above a key point or range and continue the uptrend, the StochRSI, BSSC, and OBV indicators must show upward trends.
If possible,
1. The StochRSI indicator should not enter the overbought zone.
2. The BSSC indicator should remain above the 0 level.
3. The OBV indicator should remain above the High Line.
When the above conditions are met, the uptrend is likely to continue.
The current behavior of these auxiliary indicators indicates that the conditions for a sustained uptrend are not yet met.
Therefore, when support is found near the 68,687.84 ~ 70,580.26 range, we should examine whether the above conditions are met.
-
Summary of the above:
1. Support range: 68,687.84 ~ 70,580.26
2. Beginning of a full-blown short-term uptrend: 75,719.90
3. Volatility range: 71,453.53 ~ 75,719.90
Therefore, if support is found at the support range and the trend reverses while moving sideways in the volatility range, we can interpret this as indicating a potential continuation of the uptrend.
Since indicators change position over time, their interpretation may vary depending on the position at the time of the change.
-
Thank you for reading to the end.
I wish you successful trading.
--------------------------------------------------

YouTube: youtube.com/@readcrypto9837
※ Follow X to check out the posts.
※ X를 팔로우하고 게시물을 확인하세요.
◆ t.me/readCryptoChannel
[HA-MS Indicator]
bit.ly/3YxHgvN
[OBV Indicator]
bit.ly/4dcyny3
※ Follow X to check out the posts.
※ X를 팔로우하고 게시물을 확인하세요.
◆ t.me/readCryptoChannel
[HA-MS Indicator]
bit.ly/3YxHgvN
[OBV Indicator]
bit.ly/4dcyny3
Publicações relacionadas
Aviso legal
As informações e publicações não se destinam a ser, e não constituem, conselhos ou recomendações financeiras, de investimento, comerciais ou de outro tipo fornecidos ou endossados pela TradingView. Leia mais nos Termos de Uso.
YouTube: youtube.com/@readcrypto9837
※ Follow X to check out the posts.
※ X를 팔로우하고 게시물을 확인하세요.
◆ t.me/readCryptoChannel
[HA-MS Indicator]
bit.ly/3YxHgvN
[OBV Indicator]
bit.ly/4dcyny3
※ Follow X to check out the posts.
※ X를 팔로우하고 게시물을 확인하세요.
◆ t.me/readCryptoChannel
[HA-MS Indicator]
bit.ly/3YxHgvN
[OBV Indicator]
bit.ly/4dcyny3
Publicações relacionadas
Aviso legal
As informações e publicações não se destinam a ser, e não constituem, conselhos ou recomendações financeiras, de investimento, comerciais ou de outro tipo fornecidos ou endossados pela TradingView. Leia mais nos Termos de Uso.