Long
BZRX/BTC
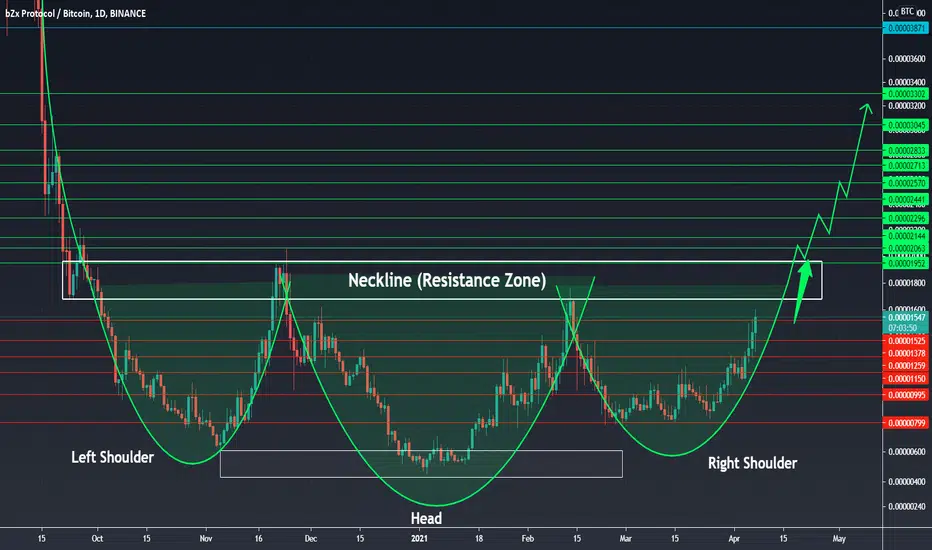
The chart says it all, bullish pattern Inverse Head & Shoulder predicts reversals in downtrend which it has been facing since the last drop in the price during Sept 2020. The final trough is being made and the price is heading upwards towards the Neckline (resistance zone) from where the BREAKOUT will start. All the targets are mentioned in green.
For educational purposes only (DYOR)
For educational purposes only (DYOR)

Publicações relacionadas
Aviso legal
As informações e publicações não se destinam a ser, e não constituem, conselhos ou recomendações financeiras, de investimento, comerciais ou de outro tipo fornecidos ou endossados pela TradingView. Leia mais nos Termos de Uso.
Aviso legal
As informações e publicações não se destinam a ser, e não constituem, conselhos ou recomendações financeiras, de investimento, comerciais ou de outro tipo fornecidos ou endossados pela TradingView. Leia mais nos Termos de Uso.