
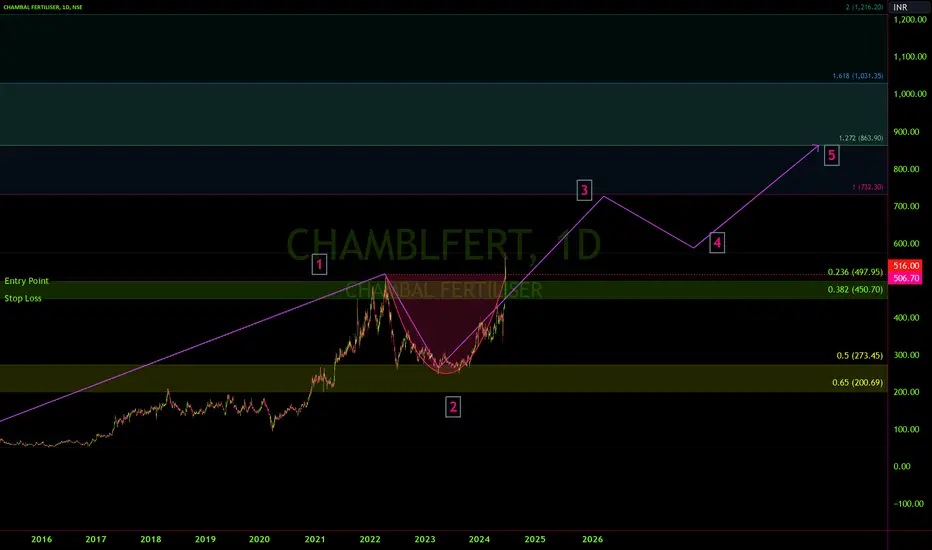
CHAMBAL Fertiliser on a daily time frame
CUP chart pattern
Monthly and Weekly RSI above 60 levels
Daily, 75 mins and 15 mins RSI declining
It should retrace the neckline levels to retest the levels.
If you calculate the retracement, it should retrace between 23.6 to 38.2%.
You can notice unusual volume on a break-out candle.
CUP chart pattern
Monthly and Weekly RSI above 60 levels
Daily, 75 mins and 15 mins RSI declining
It should retrace the neckline levels to retest the levels.
If you calculate the retracement, it should retrace between 23.6 to 38.2%.
You can notice unusual volume on a break-out candle.

Aviso legal
As informações e publicações não se destinam a ser, e não constituem, conselhos ou recomendações financeiras, de investimento, comerciais ou de outro tipo fornecidos ou endossados pela TradingView. Leia mais nos Termos de Uso.
Aviso legal
As informações e publicações não se destinam a ser, e não constituem, conselhos ou recomendações financeiras, de investimento, comerciais ou de outro tipo fornecidos ou endossados pela TradingView. Leia mais nos Termos de Uso.