

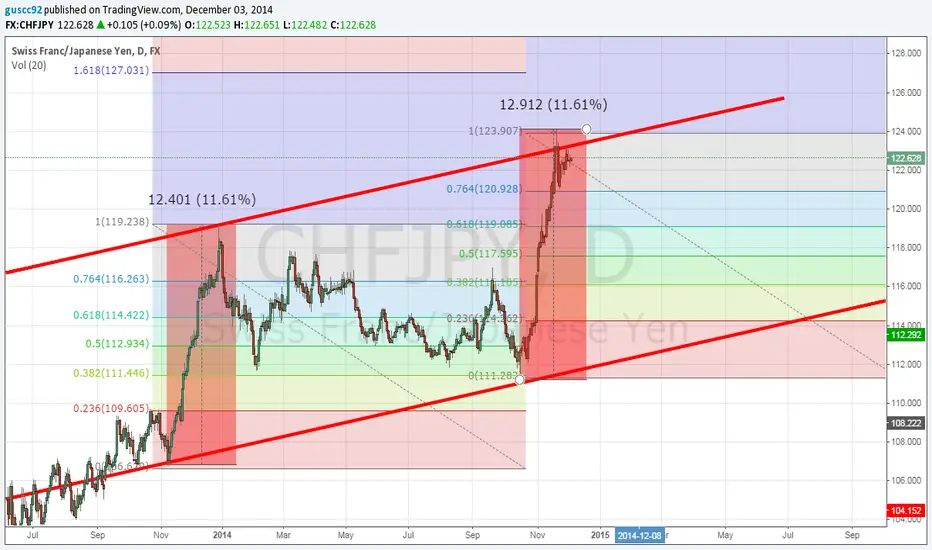
There is a marked long trend tendency with similar resistance and support lines.
Inside that, we can see how the bullish price is strong and has had a retracement of 61.8%.
Both fibonacci are exactly the same, and as we can see, the story seems to repeat.
We can also see how both range have exactly the same % with very similar price unit ranges.
Inside that, we can see how the bullish price is strong and has had a retracement of 61.8%.
Both fibonacci are exactly the same, and as we can see, the story seems to repeat.
We can also see how both range have exactly the same % with very similar price unit ranges.

Aviso legal
As informações e publicações não se destinam a ser, e não constituem, conselhos ou recomendações financeiras, de investimento, comerciais ou de outro tipo fornecidos ou endossados pela TradingView. Leia mais nos Termos de Uso.
Aviso legal
As informações e publicações não se destinam a ser, e não constituem, conselhos ou recomendações financeiras, de investimento, comerciais ou de outro tipo fornecidos ou endossados pela TradingView. Leia mais nos Termos de Uso.