
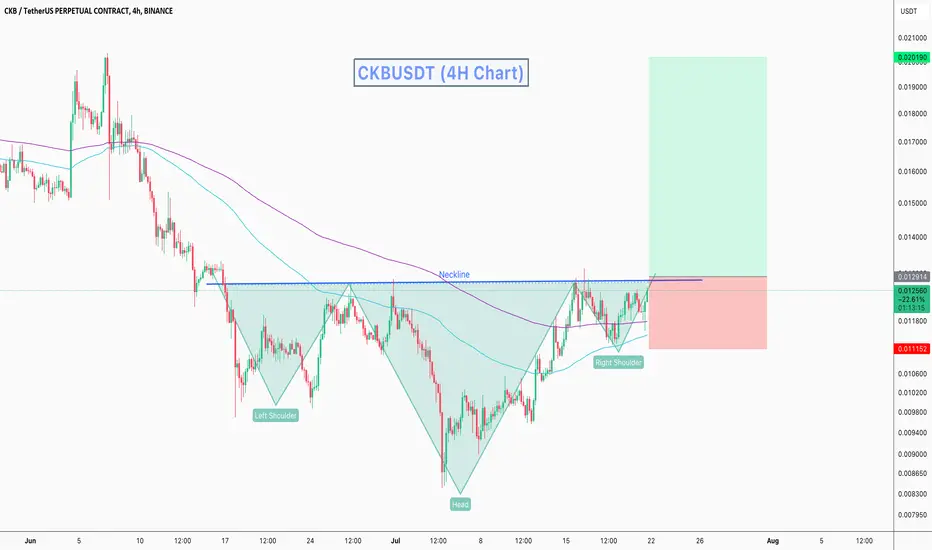
CKBUSDT Technical analysis update
CKB price is forming an inverse head and shoulders pattern. The price of the right shoulder is now moving towards the neckline for a potential breakout, 100 and 200 EMA act as good support for the right shoulder. If the breakout occurs, we can expect a strong bullish move in CKB.
Only buy after the neckline breakout.
Stop Loss: $0.0111

🚀Telegram : t.me/hexatrades
🌐Website: hexatrades.io/
🗣️Twitter(X): twitter.com/HexaTrades
🌐Website: hexatrades.io/
🗣️Twitter(X): twitter.com/HexaTrades
Publicações relacionadas
Aviso legal
As informações e publicações não se destinam a ser, e não constituem, conselhos ou recomendações financeiras, de investimento, comerciais ou de outro tipo fornecidos ou endossados pela TradingView. Leia mais nos Termos de Uso.