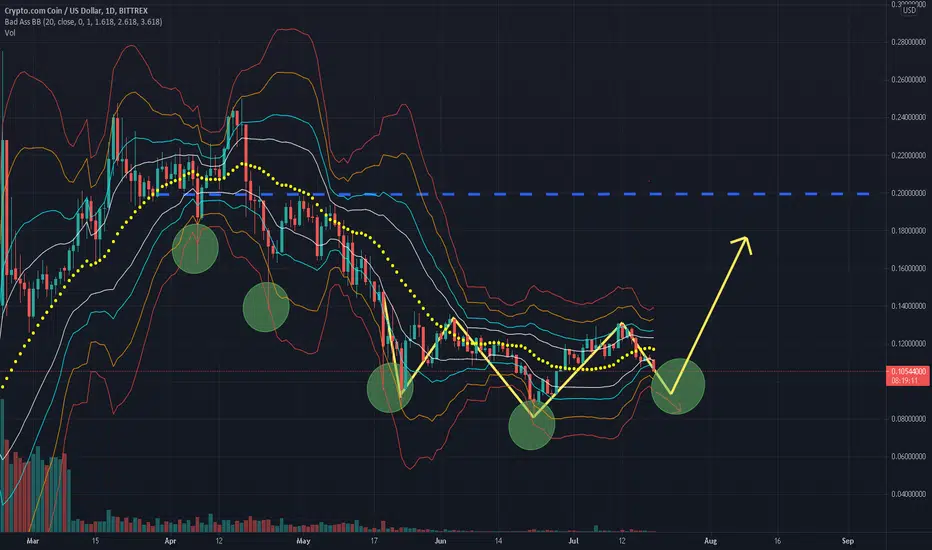
Inverse H & S pattern showing. Daily candles also look like they're inching toward the red lower Bollinger Band, indicating strong potential for a bounce. I believe we still need the right shoulder to connect with the left shoulder of the pattern at approx $0.09~ for the bounce to occur. The target for this pattern would be just below $0.20 where last resistance occurred.
Not financial advice, just my opinion.
Not financial advice, just my opinion.

Aviso legal
As informações e publicações não se destinam a ser, e não constituem, conselhos ou recomendações financeiras, de investimento, comerciais ou de outro tipo fornecidos ou endossados pela TradingView. Leia mais nos Termos de Uso.
Aviso legal
As informações e publicações não se destinam a ser, e não constituem, conselhos ou recomendações financeiras, de investimento, comerciais ou de outro tipo fornecidos ou endossados pela TradingView. Leia mais nos Termos de Uso.